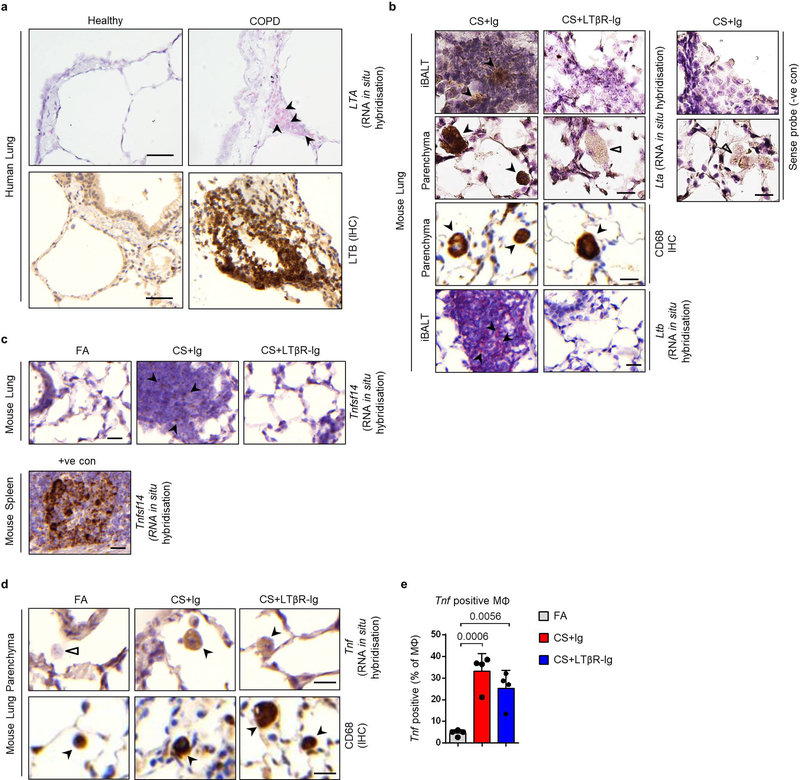
Extended Data Fig. 4. Analysis of Lta and LTb expression in human and murine lungs.
a, Representative images of in situ hybridisation analysis for LTA and immunohistochemical (IHC) analysis for LTB in lung sections from healthy and COPD patients (n=4, red signal indicated by arrow heads (LTA), brown signal (LTB) and haematoxylin counter stained, scale bar 50μm. b, Representative images of in situ hybridisation analysis for Lta and Ltb in lung sections from B6 mice exposed to CS for 6m with LTβR-Ig fusion protein or control Ig (80 μg i.p., weekly) therapeutically for 4 to 6m, and analysed at 6m (n=4 mice/group, repeated twice), (brown positive staining (Lta) and red positive staining (Ltb) indicated by arrow heads, open arrow head unstained cells, haematoxylin counter stained, scale bar 20μm). Non-staining with sense probe in CS+Ig sections shown as negative control. Representative images of immunohistochemical analysis identifying CD68 positive macrophages (brown staining indicated by arrow heads) also shown. c, Representative images of in situ hybridisation analysis for Tnfsf14 (Light) in lung sections from mice described in (b) (n=4 mice/group) (brown positive staining indicated by arrow heads, open arrow head unstained cells, haematoxylin counter stained, scale bar 20μm), plus a spleen section shown as positive control. d, Representative images of in situ hybridisation analysis for Tnf in lung sections from mice described in (b) (brown positive macrophage indicated by arrow heads, open arrow head unstained macrophage, haematoxylin counter stained, scale bar 20μm). Representative immunohistochemical analysis identifying CD68 positive macrophages (brown staining indicated by arrow heads, haematoxylin counter stained, scale bar 20μm) also shown. e, Quantification of Tnf positive macrophages across 20 random fields of view per lung (n=4). Data shown mean ± SD. P values indicated, one-way ANOVA multiple comparisons Bonferroni test.

