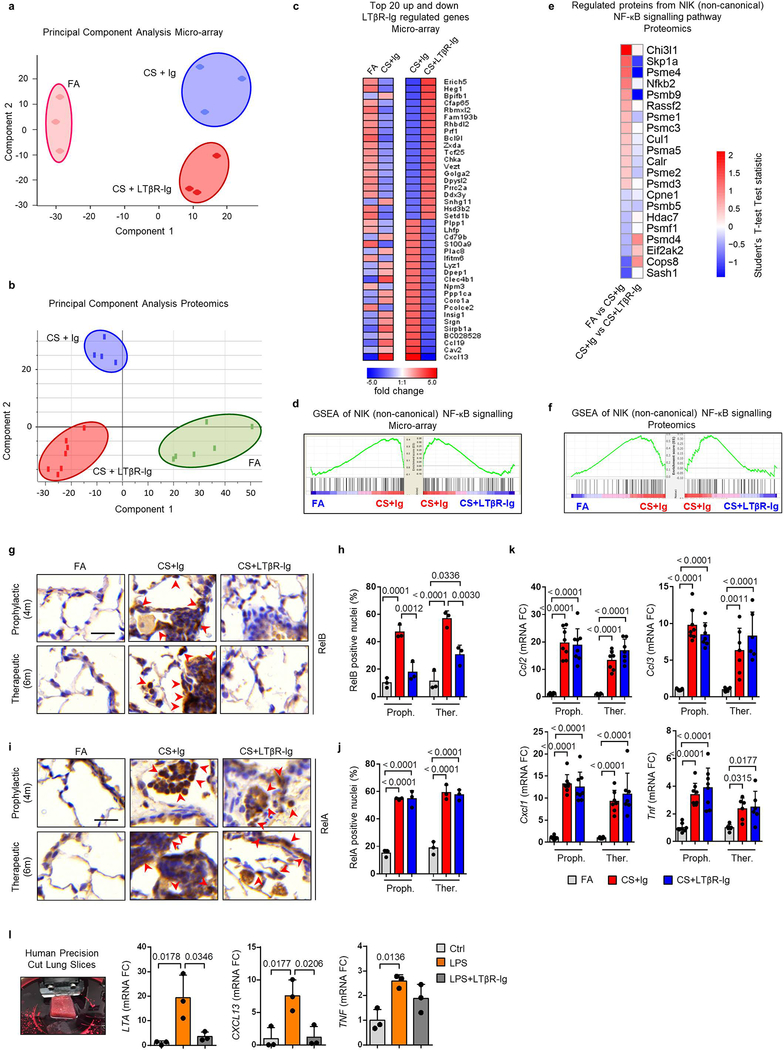
Extended Data Fig. 5. Inhibition of LTβR-signalling strongly reduces non-canonical but not canonical NF-κB-signalling in lung.
a, Principal component analysis of microarray data, using Mouse Ref-8 v2.0 Expression BeadChips (Illumina), undertaken on lung tissue from mice exposed to FA or CS for 6m, plus LTβR-Ig fusion or control Ig (80 μg i.p., weekly) therapeutically from 4 to 6m (n=3 mice/group). b, Principal component analysis of normalised z-scored MS-intensities from proteomics of whole lung lysates from mice exposed to FA (n=6) or CS for 6m, plus LTβR-Ig fusion (n=7) or control Ig (n=4) (80 μg i.p., weekly) from 4 to 6m. c, Heat map depicting the top 20 up and down LTβR-Ig regulated genes presented as fold change (FDR<10%) from the microarray data described in (a). Left, expression in CS+Ig relative to FA – exposed mice; Right, expression in CS+LTβR-Ig relative to CS+Ig – exposed mice. d, GSEA of the NIK (non-canonical) NF-κB signalling (GO:0038061) pathway of the microarray data from (a). e, Heat map of significantly regulated proteins from the NIK (non-canonical) NF-κB signalling (GO:0038061) pathway as determined by Student’s T-test Test statistic from the proteomics data described in (b). f, GSEA of the NIK (non-canonical) NF-κB signalling (GO:0038061) pathway of the normalised proteome data described in (b). g, Representative images of two independent experiments of immunohistochemical analysis for RelB in lung sections from B6 mice exposed to FA or CS for 4 and 6m, plus LTβR-Ig fusion or control Ig (80 μg i.p., weekly) prophylactically from 2 to 4m and analysed at 4m, and therapeutically from 4 to 6m and analysed at 6m (brown signal indicated by arrow heads, haematoxylin counter stained, scale bar 25μm). h, Quantification of RelB positive alveolar epithelial nuclei from the IHC sections in (g), n=3 mice/group. i, Representative images of two independent experiments of immunohistochemical analysis for RelA in lung sections from the mice described in (g) (brown signal indicated by arrow heads, haematoxylin counter stained, scale bar 25μm). j, Quantification of RelA positive alveolar epithelial nuclei from the IHC sections in (i), n=3 mice/group. k, mRNA expression levels of Ccl2, Ccl3, Cxcl1 and Tnf determined by qPCR in whole lung from the mice described in (g), n=4 mice/group, repeated twice, pooled data shown. l, mRNA expression levels of LTA, CXCL13 and TNF determined by qPCR in ex vivo human precision-cut lung slices stimulated for 24h with LPS (10μg/ml) in the presence or absence of human LTβR-Ig fusion protein (1μg/ml) (n=3 independent experiments from 3 separate lungs). Left image shows a representative picture of preparing a lung slice from the 3 independent experiments. Data shown mean ± SD. P values indicated, one-way ANOVA multiple comparisons Bonferroni test.

