
Figure 2.
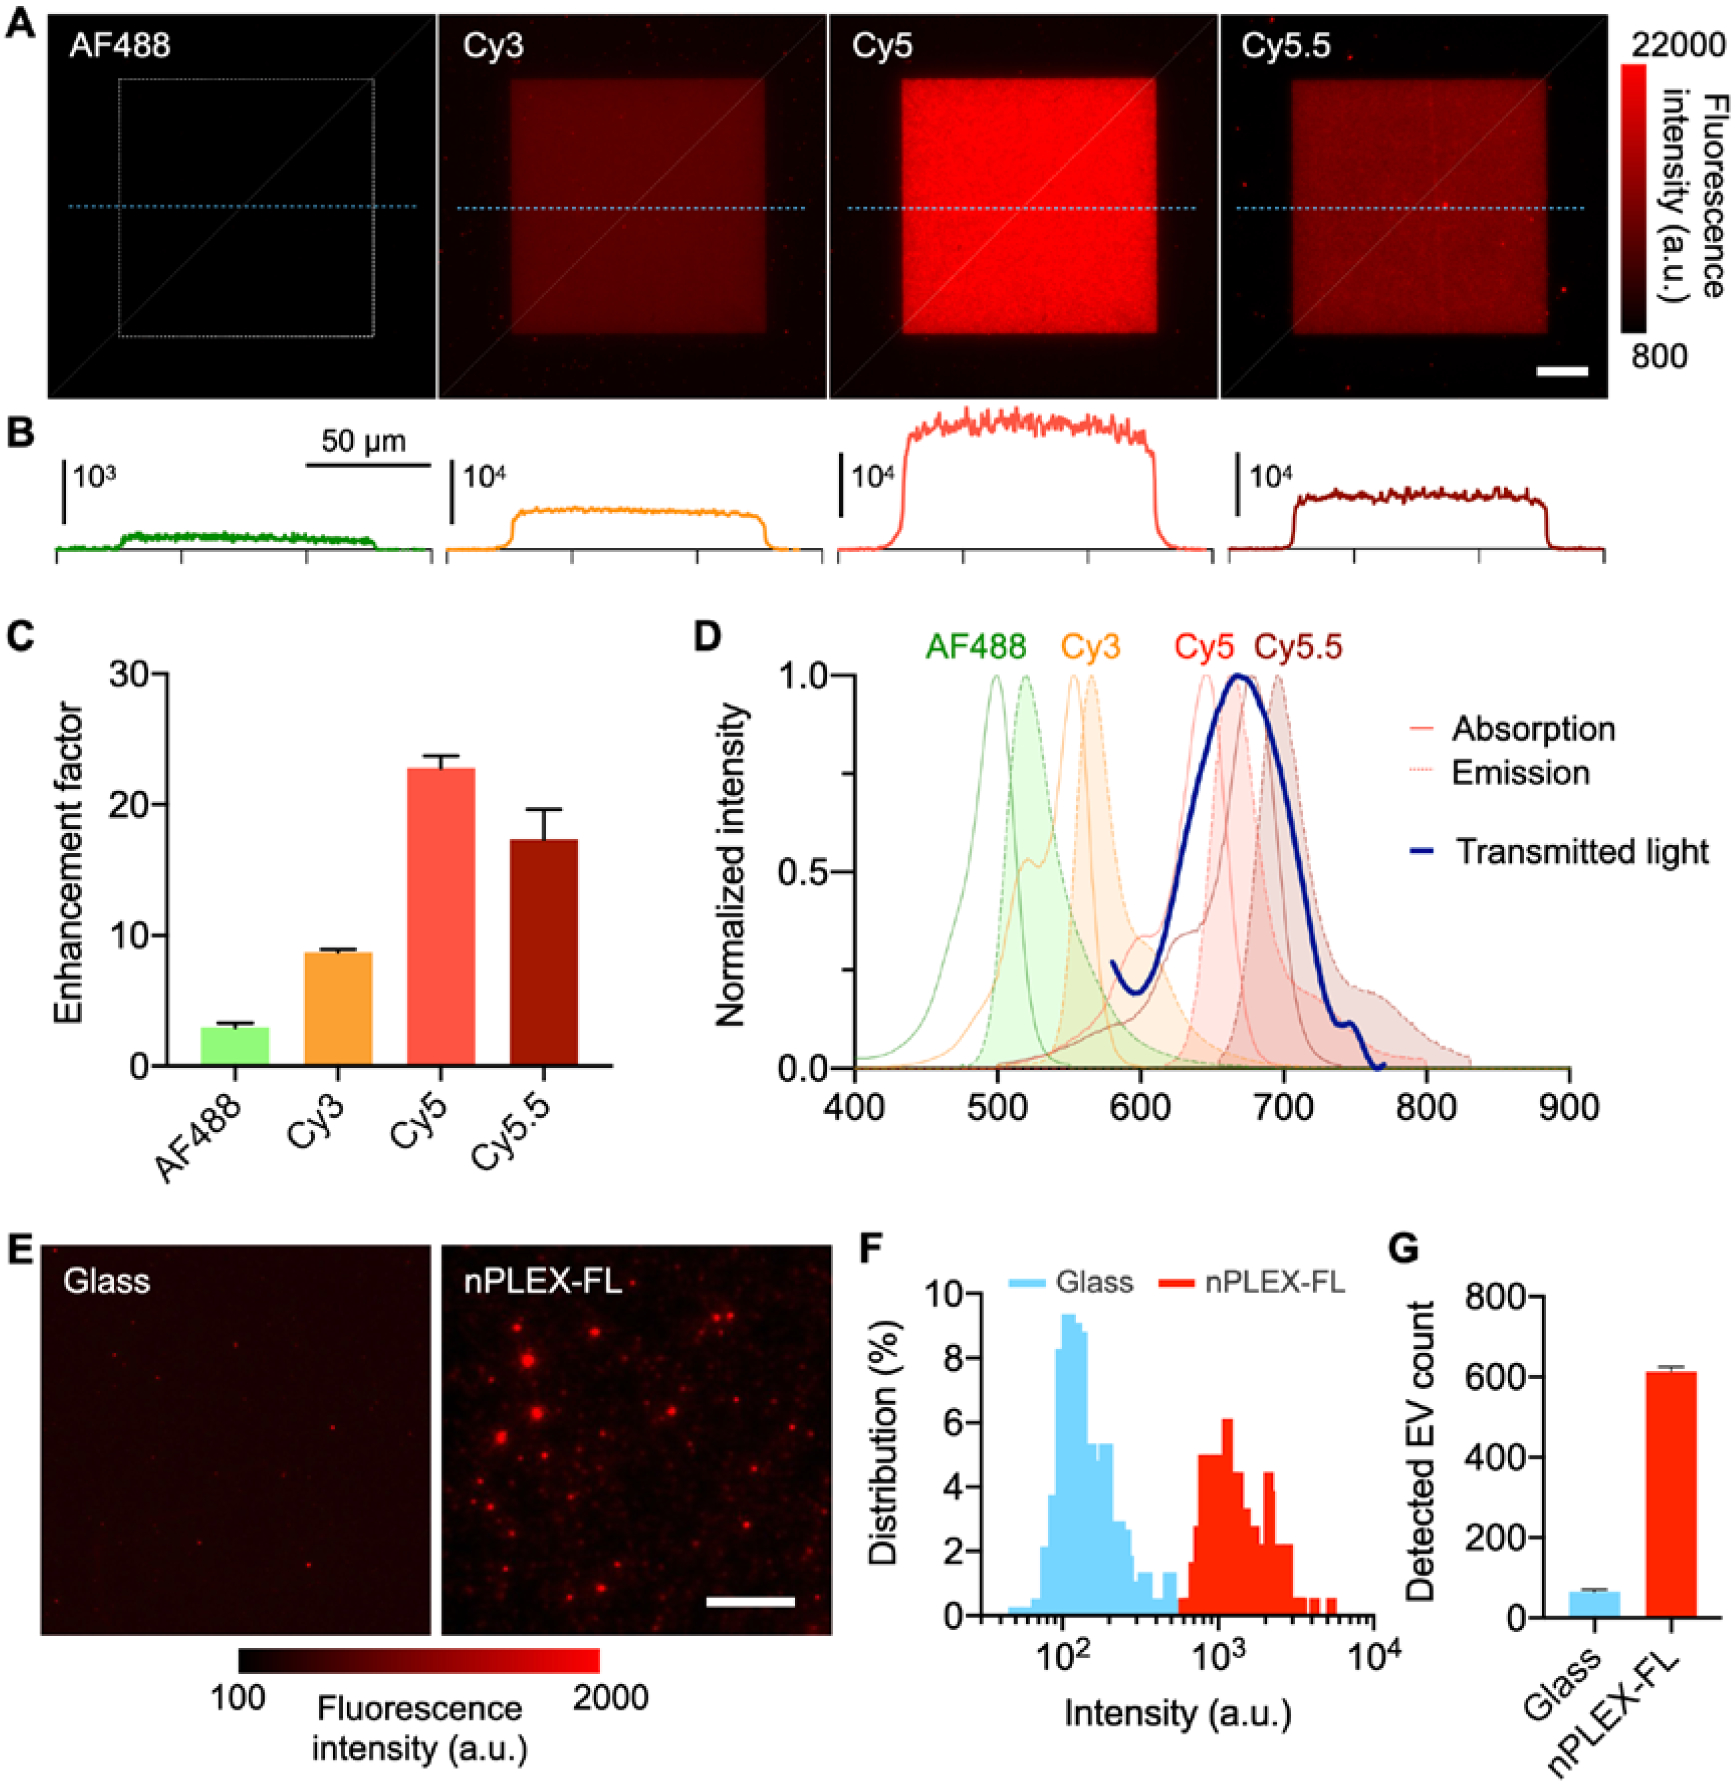
System characterization. A) Fluorescence images of nPLEX-FL chips coated with four different colors of fluorophore-conjugated streptavidin (streptavidin with AF488, Cy3, Cy5, or Cy5.5). Scale bar, 20 μm. Au nanoholes are made in the 100 × 100 μm2 sized square area highlighted by a white dashed box. B) Cross-sectional intensity profiles along the blue dashed lines. C) Enhancement factors of fluorescence intensity in different fluorescence channels (the nanohole area vs. flat Au areas). D) Plasmon-supported light transmission spectrum through periodic nanoholes overlaid with absorption/emission spectra of fluorophores E) Biotinylated EVs were captured on glass and nPLEX-FL substrates coated with the DOPA-based bioadhesive. The captured EVs were labeled with Cy5-conjugated streptavidin and imaged. Scale bar, 10 μm. F-G) Histograms of pixel intensities (F) and the number of detected EVs. G) between glass and nPLEX-FL substrates.