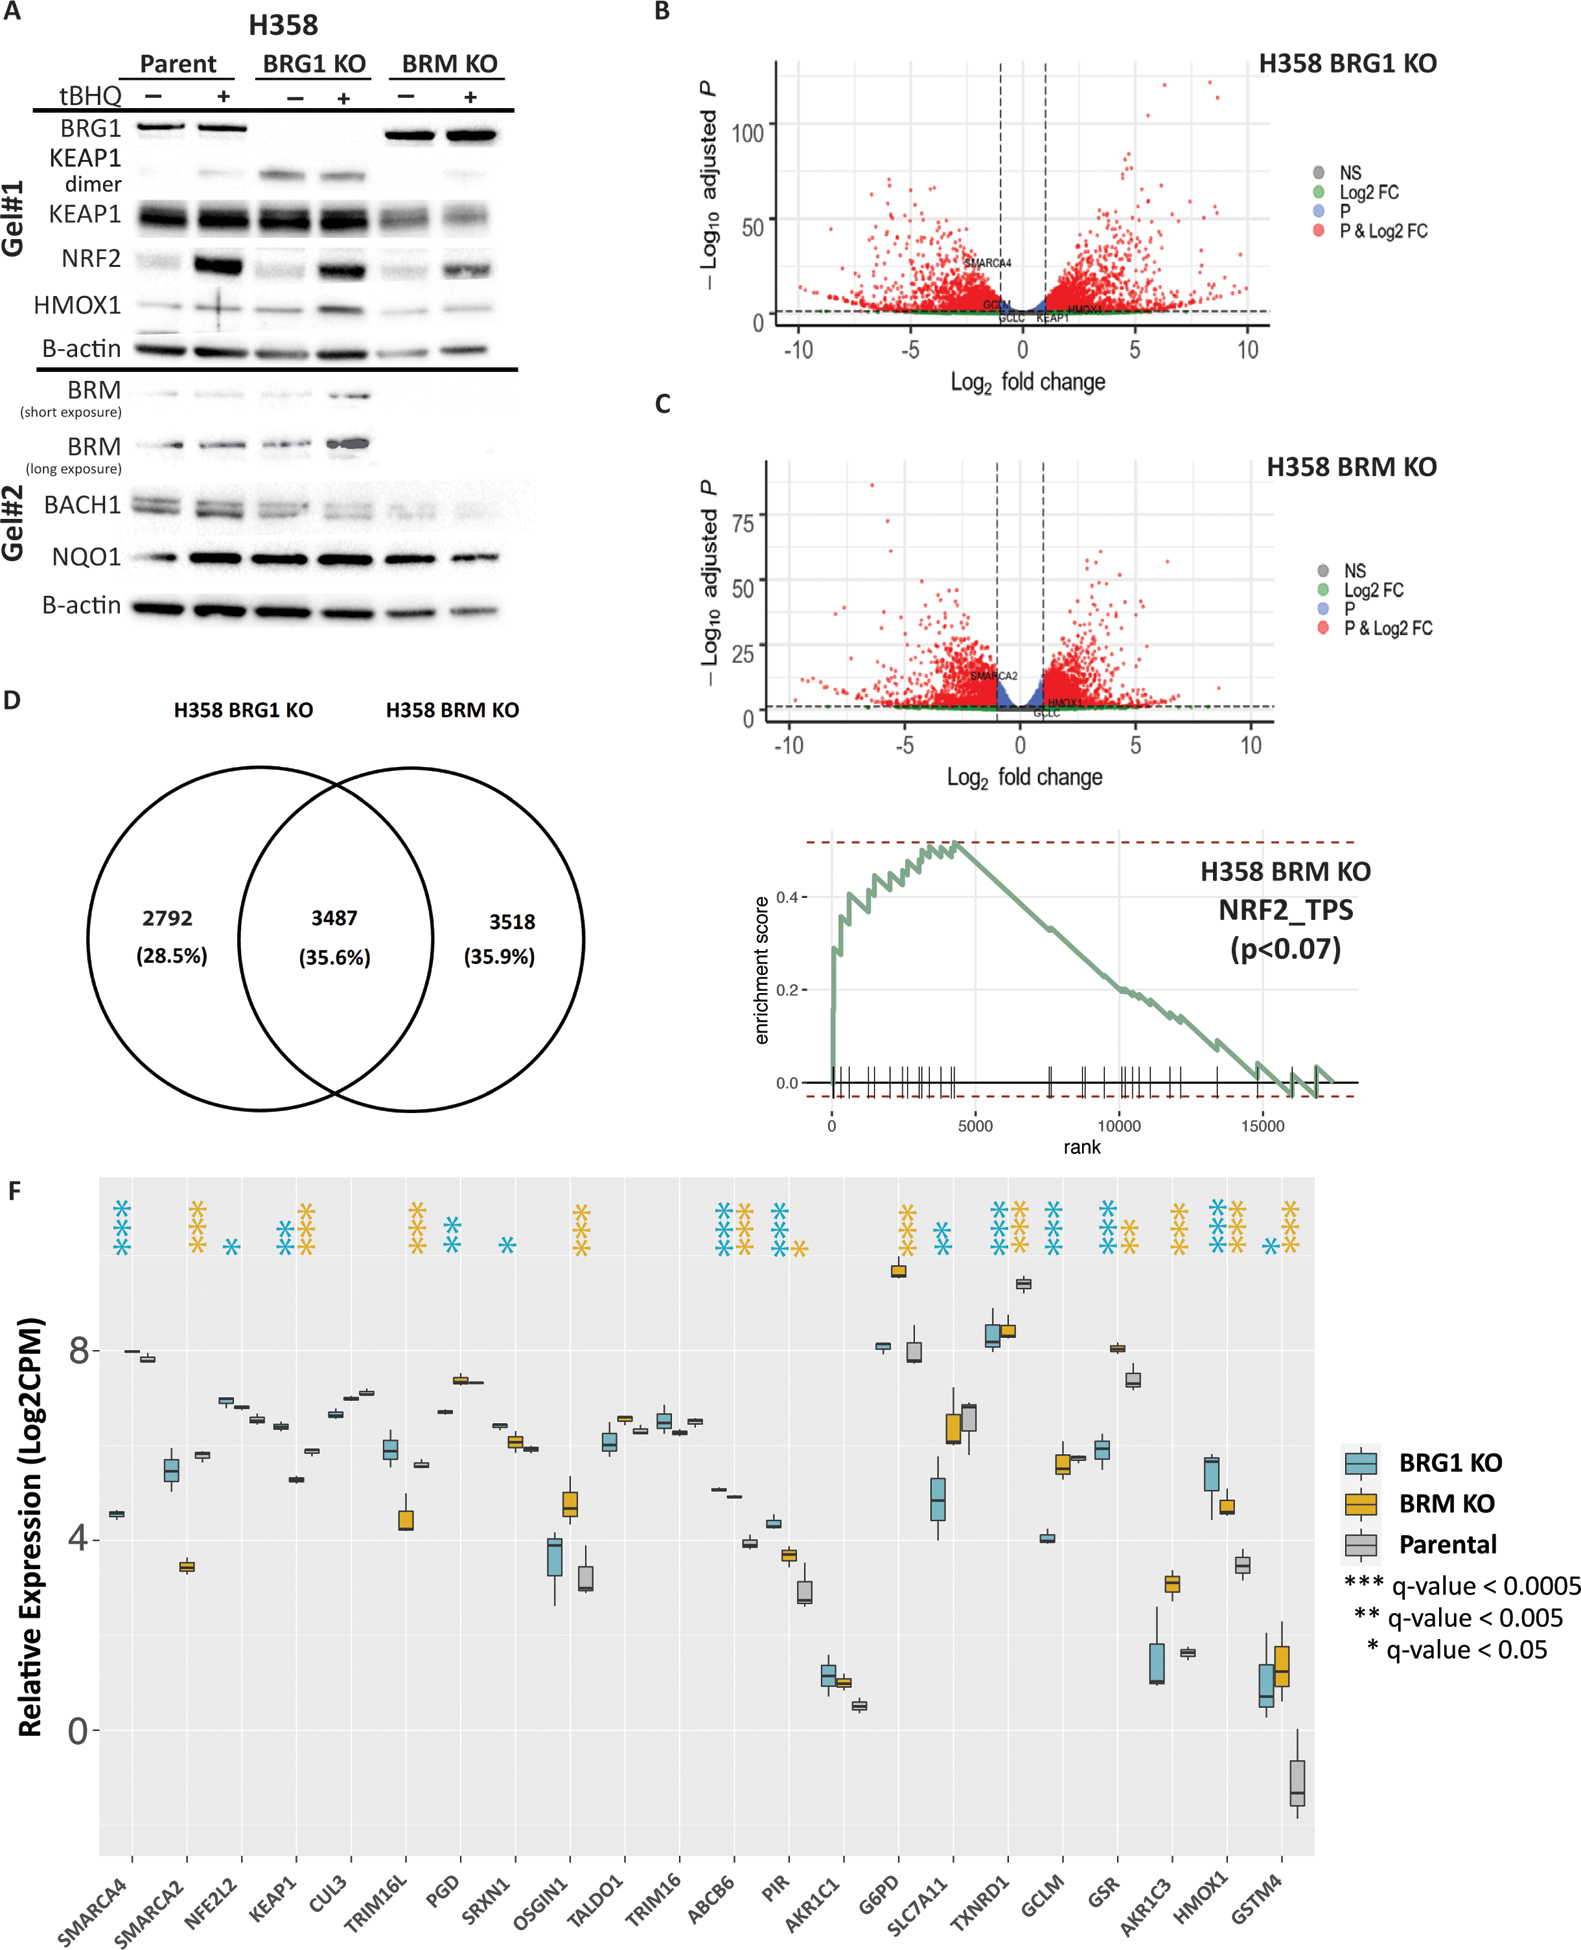
Figure 4. Characterization of H358 BRG1 and BRM knockout cell lines.

CRISPR/Cas9 engineering was used to delete BRG1 or BRM from H358 cells. (A) Western blots showing the effects on CRISPR knockouts of BRG1 and BRM on NRF2, KEAP1 and downstream targets. (B) Volcano plot results of RNA-seq differential gene expression (H358 BRG1_KO/Parent) for protein coding genes using DESeq2 (n = 19,879 genes total). Significantly upregulated genes (padj < 0.05 and Log2FoldChange > 1) are colored in red (n = 2,082 genes). Significantly downregulated genes (padj < 0.05 & Log2FoldChange < −1) are colored in blue (n = 2010 genes). Non-significant genes are colored in grey (n = 15,787 genes). SMARCA4/BRG1 and NRF2 target genes are identified. (C) Volcano plot results of RNA-seq differential gene expression (H358 BRM_KO/Parent) for protein coding genes using DESeq2 (n = 19,879 genes total). Significantly upregulated genes (padj < 0.05 and Log2FoldChange > 1) are colored in red (n = 1,785 genes). Significantly downregulated genes (padj < 0.05 & Log2FoldChange < −1) are colored in blue (n = 1,531 genes). Non-significant genes are colored in grey (n = 16,653 genes). SMARCA2/BRM and NRF2 target genes are identified. (D) Venn diagram showing the number of genes that change relative to the H358 parental cell line exclusive to the H358 BRG1 KO cell line (n = 2792 genes), exclusive to the H358 BRM KO cell line (n = 3,518 genes) and the number of genes that change in both cell lines (n = 3, 487 genes). (E) Enrichment plot for NRF2 HALLMARK terms in RNA-seq data (LCPM normalized TPMs) using GSEA (MSigDB GO gene set - C5 all v6.0). (F) mRNA expression of NRF2 target genes derived from the H358 parent, H358 BRG1 KO and the H358 BRM KO cell lines. Poly A capture RNAseq was performed in biological triplicate. Raw counts as quantified by Salmon were normalized by the trimmed means method and Log2 transformed. Indicated q-values were estimated using DESeq2, comparing parental H358 to the indicated knock out cell lines.
