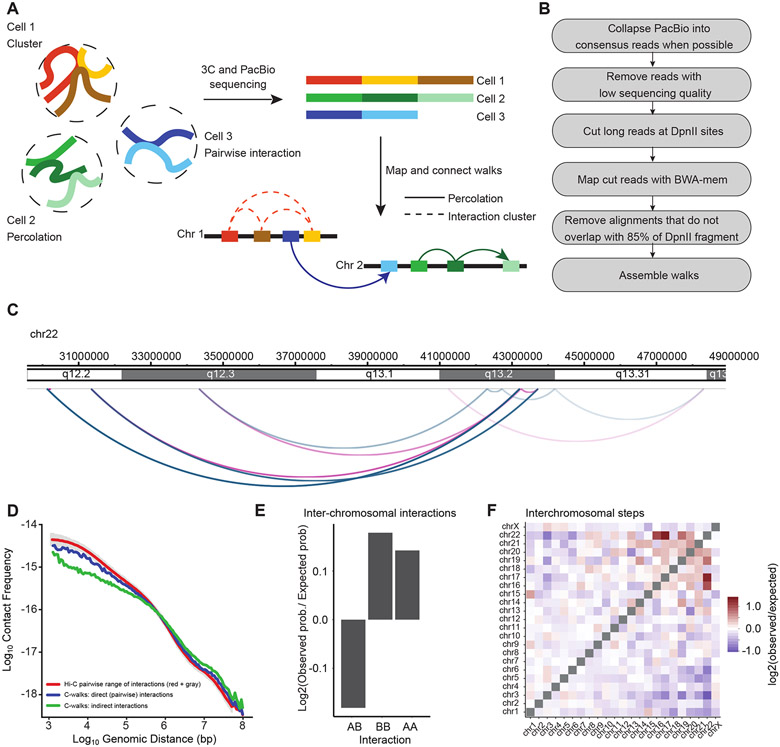
Figure 1:
Outline of MC-3C. A: Schematic of the MC-3C approach. By performing PacBio sequencing on the products of a 3C experiment fragments that belong to the same interaction cluster or percolation path are captured as chimeric long reads. B: Computational pipeline used to process PacBio reading reads to generate C-walks. C: Example of a C-walk. Red arcs represent steps in the positive direction (in the direction of the right telomere of the chromosome) and blue arcs represent steps in the negative direction (in the direction of the left telomere of the chromosome). The steps get darker during the walk. D: Interaction frequency as a function of genomic distance for direct contacts in C-walks (26,603 interactions), indirect contacts in C-walks (32,244 interactions), and down sampled Hi-C (26,603 interactions). Grey shade represents the variance in the Hi-C data when P(s) is calculated for diferente samples of 26,603 Hi-C interactions. E. Comparison of inter-chromosomal A-A, B-B and A-B interactions. An expected probability of A-A, B-B and A-B interactions was calculated from all detected fragments that participate in inter-chromosomal interactions and compared to the observed proportion of interactions and converted to a base-2 logarithm. The positions of A and B compartments were calculated by principal component analysis of Hi-C data binned at 250 kb resolution 10. The expected A-A, B-B and A-B interactions that would occur by random chance were calculated by multiplying the proportion of A and B fragments present in the observed C-walks. F. Observed/expected number of inter-chromosomal steps. Small chromosomes preferentially interact. The expected values were calculated in the same manner as panel E but considering only inter-chromosomal interactions. Source date for panels d and e are available online.

