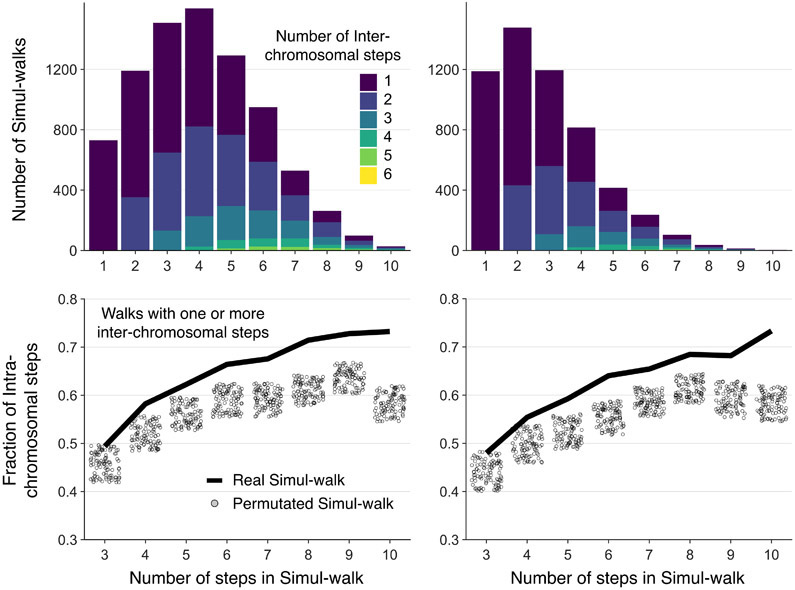
Extended Data Fig. 6. Simul-walks statistics not dependent on the selected percolation parameters.
Simul-walks statistics do not change considerably by changing the selected percolation parameter rcutoff (Left: rcutoff = 75 nm, Right: rcutoff = 60 nm). The left panel is shown in the main Figure 4 because the rcutoff is chosen in such a way that the maximum number of steps in simul-walks in the histogram is ~3-4 which is similar to the peak in the histogram of C-walks in Figure 2C. Regardless, the top two histograms show that most walks still involve only 1 or 2 inter-chromosomal or inter-domain interactions. At the bottom, the shift between the simul-walks (black solid lines) and randomly permutated versions (circles) remains the same as well. The rcutoff value cannot be changed much more than this, because the minimum center to center distance of two touching beads is ~50-60 nm and choosing larger cutoffs will result in skipping some neighboring chains in the percolation path search. Therefore, our results are independent of the parameters we used to find the simul-walks.

