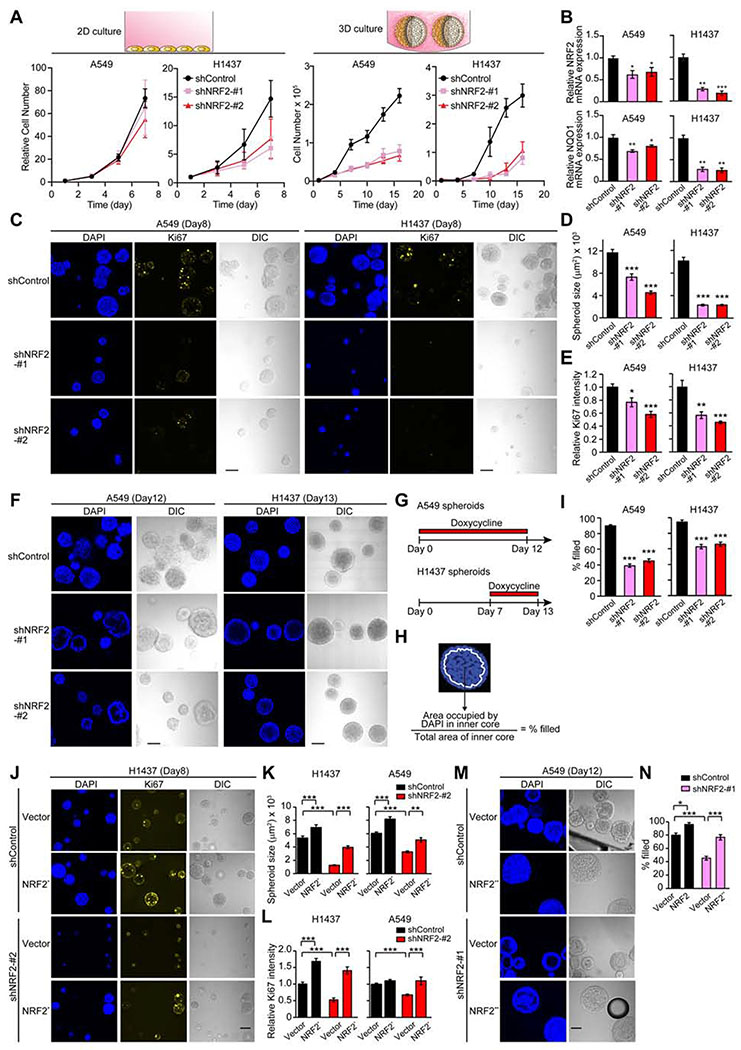
Figure 1. Downregulation of NRF2 Significantly Impacts Cell Growth in 3D Culture.
(A) Growth of the indicated cell lines in 2D and 3D culture conditions. For A549 cells, data shown as mean ± SEM from three independent experiments. For H1437 cells, data shown as mean ± SD from one representative experiment out of two independent experiments performed in duplicate–quadruplicate. (B) mRNA expression of NRF2 and NQO1 in the indicated cell lines after 72 hours of shRNA induction in 2D culture from three independent experiments. Data were normalized to shControl. (C) Representative confocal images of the indicated spheroids from three independent experiments. (D) Quantification of spheroid size from experiments described in (C) (n = 55–112). (E) Quantification of Ki67 signal relative to shControl from experiments described in (C) (n = 22–46). (F) Representative confocal images of the indicated spheroids from three independent experiments. (G) Timeline of doxycycline treatment (1 μg/ml) in (F). (H) Definition of inner space and calculation of % filled. White line represents the boundary of inner space. (I) Percentage of filled inner space from experiments described in (F) (n = 45–77). (J) Representative confocal images of the indicated spheroids from two independent experiments. (K) Quantification of spheroid size in the indicated day-8 spheroids (n = 59–150). (L) Quantification of Ki67 signal relative to spheroids transduced with both shControl and an empty vector in the indicated day-8 spheroids (n = 59–150). (M) Representative confocal images of the indicated spheroids from two independent experiments. (N) Percentage of filled inner space from experiments described in (M) (n = 14–22). Unless otherwise noted, the cells were treated with 1 μg/ml doxycycline throughout the experiments. In (B), (D), (E), and (I), unpaired two-tailed t-test was used to determine statistical significance (*p < 0.05, **p < 0.01, and ***p < 0.001 compared to shControl). In (K), (L), and (N), one-way ANOVA was used to determine statistical significance (*p < 0.05, **p < 0.01, and ***p < 0.001). Scale bar represents 100 μm. All data shown as mean ± SEM unless otherwise indicated.

