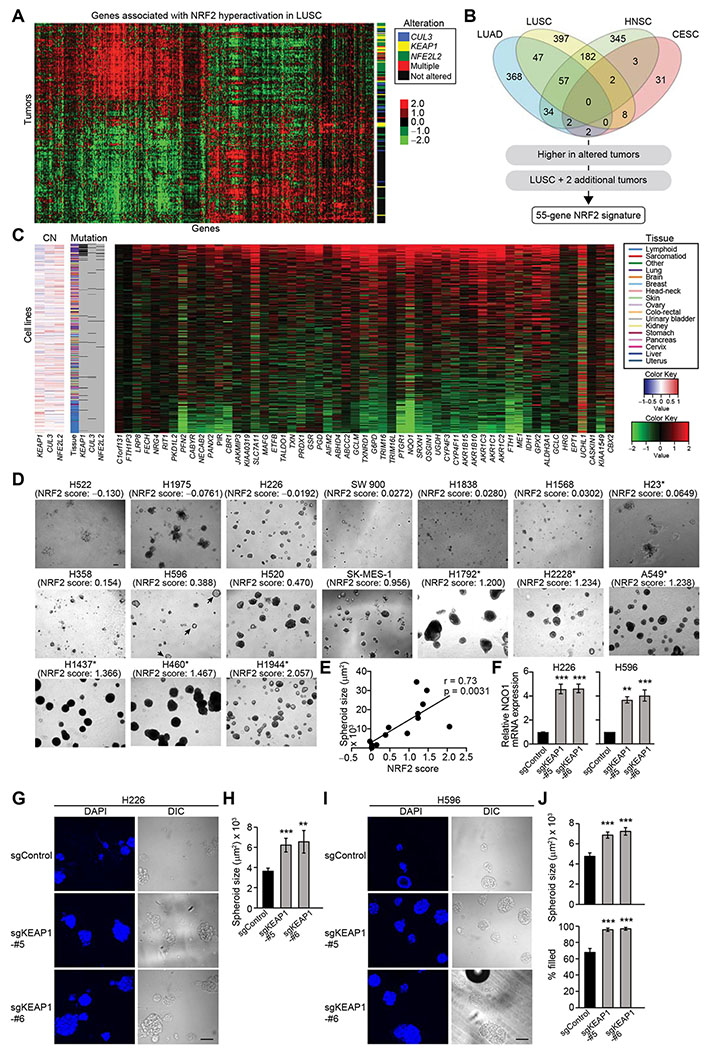
Figure 2. High NRF2 Activity Is Required for Efficient Spheroid Formation.
(A) Genes associated with NRF2 hyperactivation in TCGA LUSC samples (n = 198). Heatmap shows log2 median-centered RNA-seq gene expression data. Status of genetic alterations in the NRF2 pathway for each tumor is displayed on the right. (B) Venn diagram showing the number of genes associated with NRF2 hyperactivation in TCGA cancer types. The 1,466 genes associated with NRF2 hyperactivation were further limited to a 55-gene NRF2 signature using the outlined criteria. (C) Expression of the 55 NRF2 signature genes in 675 cancer cell lines. Heatmap shows log2 median-centered RNA-seq gene expression data. Copy number (CN) alteration and mutation status of KEAP1, CUL3, and NFE2L2 as well as tissue of origin are displayed. (D) Representative images of day-16 spheroids of lung cancer cell lines. Asterisks indicate the existence of genetic alterations in the NRF2 pathway. (E) Correlation between NRF2 score and spheroid size from experiments described in (D). H522, H1975, and H23 cells were excluded from the correlation analysis because they do not form spheroids but just clumps of cells. (F) mRNA expression of NQO1 in the indicated cell lines from three independent experiments. Data were normalized to sgControl. (G) Representative confocal images of the indicated day-14 spheroids from two independent experiments. (H) Quantification of spheroid size from experiments described in (G) (n = 65–97). (I) Representative confocal images of the indicated day-12 spheroids from two independent experiments. (J) Quantification of spheroid size and percentage of filled inner space from experiments described in (I) (n = 53–91). In (F), (H), and (J), one-way ANOVA (F) or unpaired two-tailed t-test (H and J) was used to determine statistical significance. **p < 0.01 and ***p < 0.001 compared to sgControl. Scale bar represents 100 μm. All data shown as mean ± SEM.

