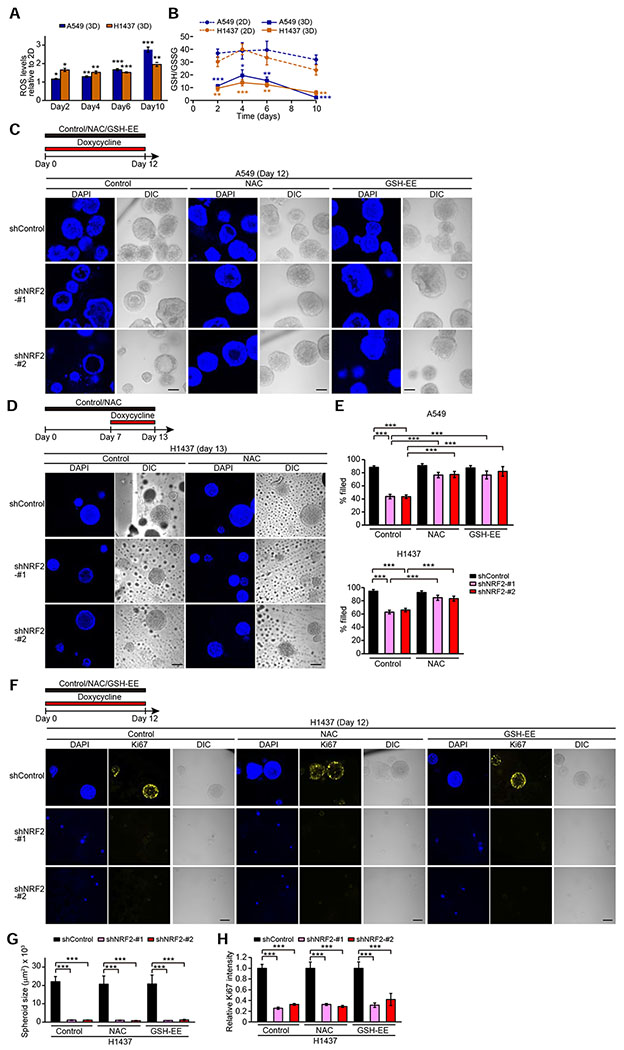
Figure 3. Antioxidant Treatment Rescues Survival of Inner Cells but Not Loss of Proliferation Caused by NRF2 Downregulation in Spheroids.
(A) ROS levels relative to monolayer cells in the indicated spheroids from three independent experiments. (B) GSH/GSSG ratio in the indicated cells cultured in 2D or 3D from three independent experiments. (C and D) Representative confocal images of the indicated spheroids from two independent experiments. (E) Percentage of filled inner space from experiments described in (C) and (D) (n = 10–64). (F) Representative confocal images of the indicated spheroids from two independent experiments. (G) Quantification of spheroid size from experiments described in (F) (n = 4–24). (H) Quantification of Ki67 signal relative to NAC- and GSH-EE-untreated spheroids with shControl from experiments described in (F) (n = 4–24). In (A) and (B), unpaired two-tailed t-test was used to determine statistical significance (*p < 0.05, **p < 0.01, and ***p < 0.001 compared to 2D cells). In (C), (D), and (F), the spheroids were treated with 1 μg/ml doxycycline and either vehicle, 1 mM NAC, or 1 mM GSH-EE for the indicated time period. In (E), (G), and (H), one-way ANOVA was used to determine statistical significance (***p < 0.001). Scale bar represents 100 μm. All data shown as mean ± SEM.

