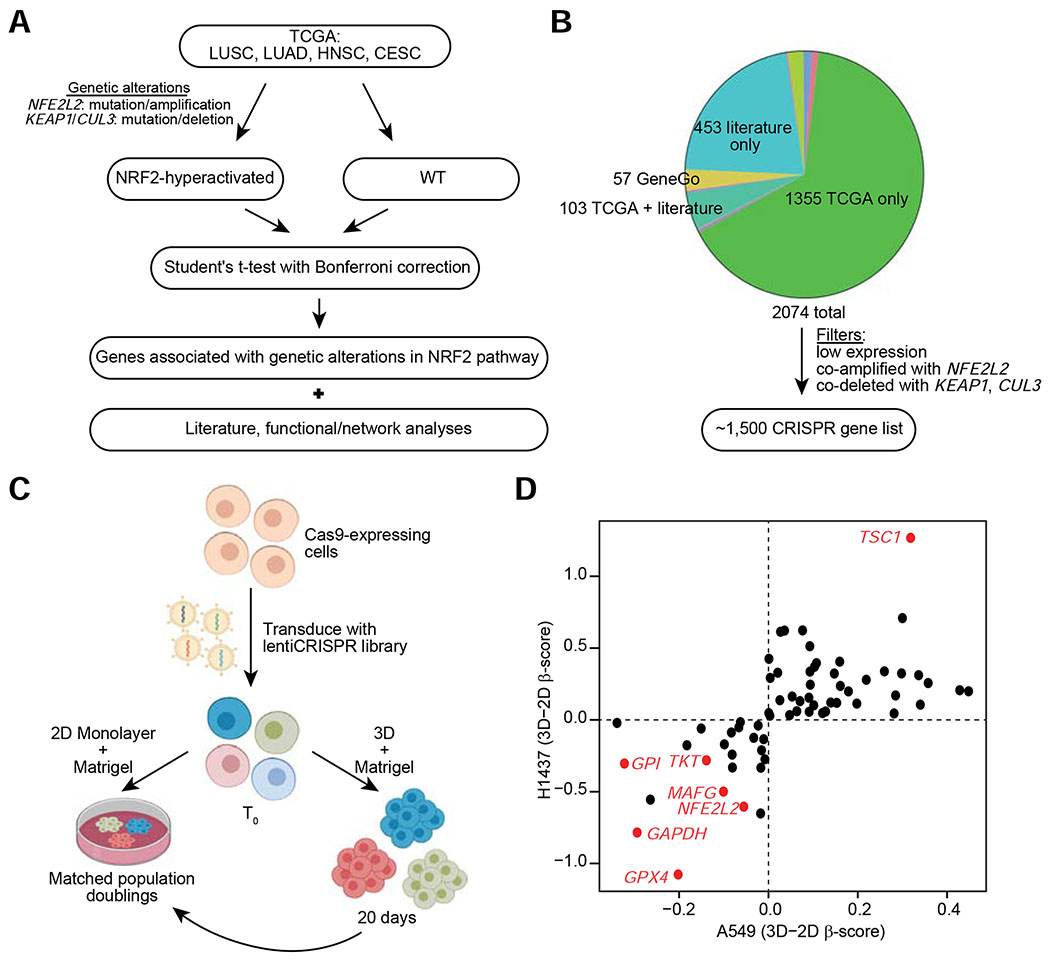
Figure 4. CRISPR Screening Approach to Identify Dependencies in Spheroids of NRF2-Hyperactivated Cell Lines.
(A) Schematic for the identification of genes for the focused CRISPR library. (B) Distribution of source of genes in the focused CRISPR library. The most common sources of genes are highlighted. Non-identified groups include genes derived from more than one of the common sources or through Project Achilles. Expression filters were applied to further narrow down the list to ~1,500 genes. (C) Schematic for the pooled CRISPR screening approach. (D) Hit genes common to both A549 and H1437 cell lines. For each cell line, the difference in β-score between 3D and 2D growth culture conditions is plotted.

