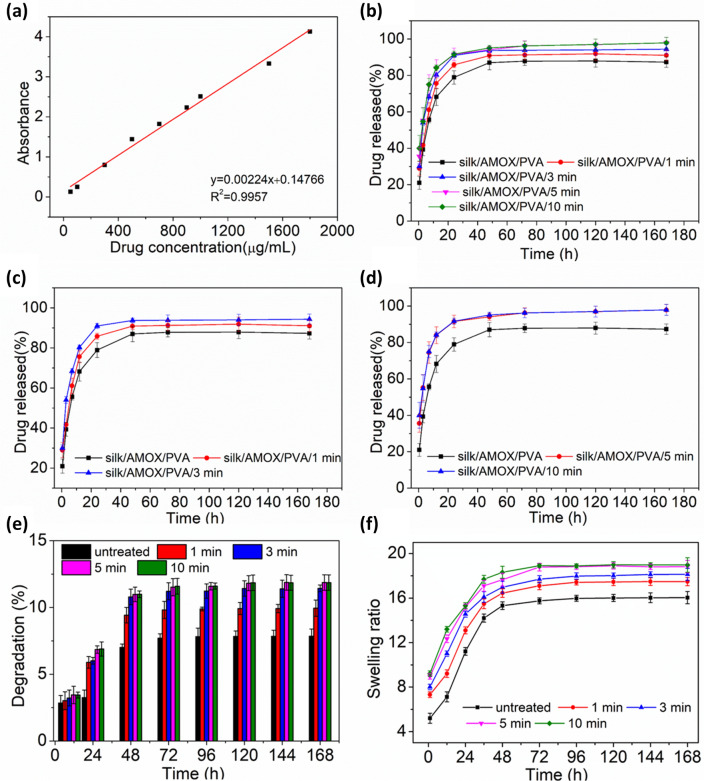
Fig. 4.
a Standardization graph for AMOX released in PBS 7.4pH for different drug concentrations. b–d are drug release profiles of the plasma treated and untreated silk/AMOX/PVA nanofibers with different treatment time ranging from 1 to 10 min. e and f are degradation (%) and swelling ratio of the untreated and plasma treated silk/PVA nanofibers for 1, 3, 5, 10 min respectively

