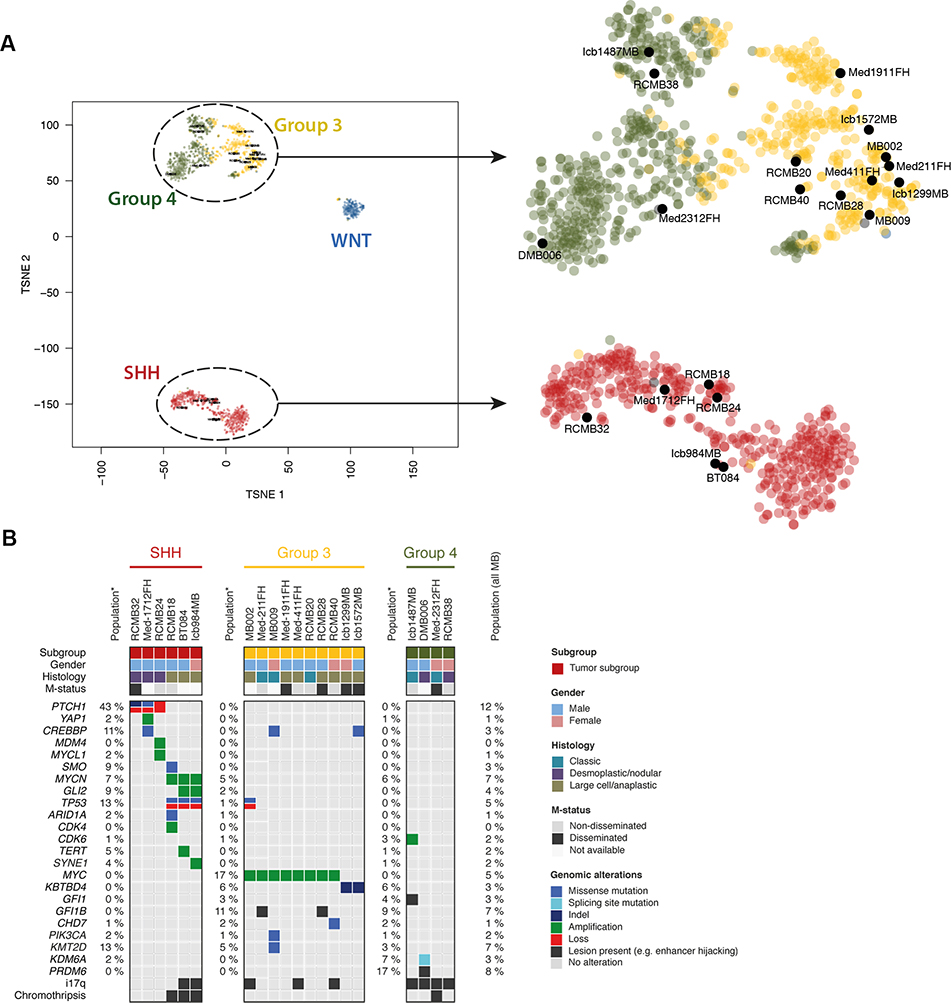
Figure 1: Molecular characterization of PDXs reveals subgroups and genetic lesions.
(A) tSNE clustering of DNA methylation profiles of PDX models with a reference cohort of MBs representing all four major subgroups shows that PDX models cluster with the subgroups as predicted by the Heidelberg brain tumor classifier (see Supp. Table 1). (B) Summary of subgroup, gender, histology and mutation status (m-status) of patients from whom PDXs were generated, along with the genomic alterations found in each PDX. Genomic alterations listed are those identified as previously observed in MB as a cancer gene and found in our PDXs (see Supp Table 2A,B). Numbers on the left side of each subgroup represent the percentage of patients from that subgroup with the corresponding genetic lesion; numbers on the far right represent the percentage of the total MB population with the lesion.

