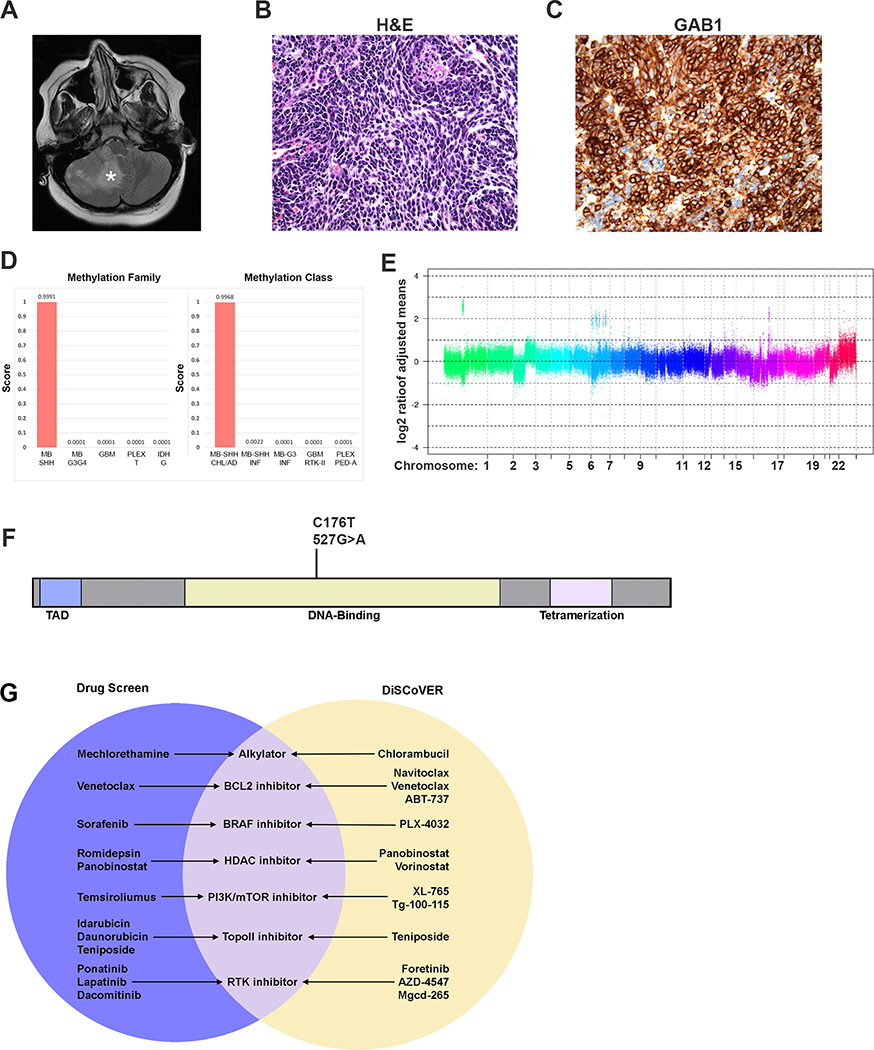
Figure 6: A combination of DNA, RNA, and drug sensitivity analysis is feasible in patients.
(A) T2-weighted MRI reveals a right hemispheric cerebellar tumor with significant mass effect (B) Hematoxylin and Eosin staining of tumor sections reveals a small-round blue cell neoplasm with anaplastic features consistent with a diagnosis of large cell/anaplastic MB (C) GAB1 staining of tumor sections reveals diffuse positive staining. (D) DNA methylation family and class analysis scores. (E) SNP microarray analysis reveals chromosomal gains and losses. (F) The missense TP53 mutation at the nucleotide and amino acid level revealed by WGS. (G) The Venn diagram shows overlapping classes of drugs, predicted by both drug screening (purple) and DiSCoVER analysis (yellow). The middle (lavender) shows drug classes predicted by both approaches.

