
Figure 2. Validation of the bead-based flow method.
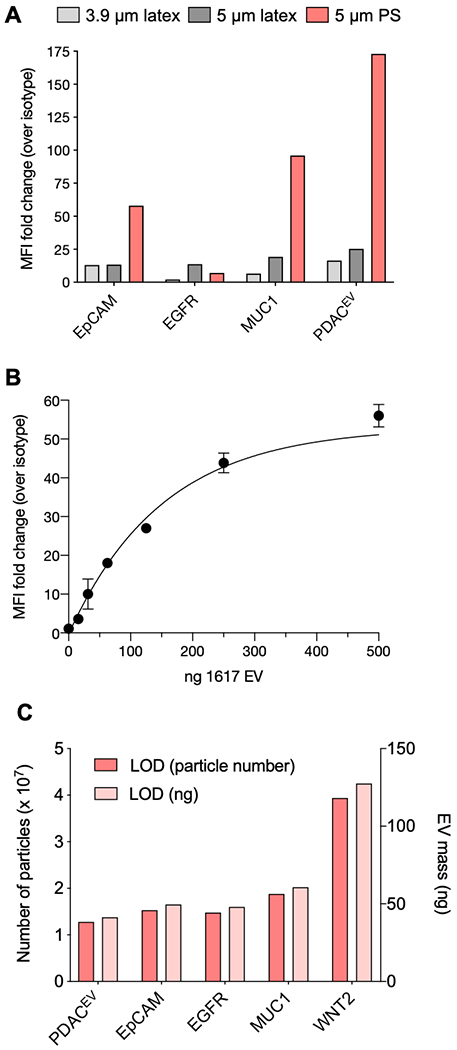
A. 1617 PDAC EVs were adsorbed onto 3.9 μm (light gray, 1.3 x 10⁷ particles), 5 μm (dark gray, 4.9 x 10⁶ particles) aldehyde/sulfate latex beads, or biotinylated and captured on 5 μm streptavidin polystyrene beads (red, 1.8 x 10⁶ particles). EV-bead conjugates were stained with antibodies against EpCAM, EGFR, MUC1, or a five antibody cocktail (PDACEV: EpCAM, EGFR, MUC1, WNT-2, GPC1). Median fluorescence intensity (MFI) from each antibody was compared to an identical EV-bead conjugate stained with an isotype control antibody and the resulting fold change in MFI is shown. B. 1617 EV dilution in the BEAD flow assay. Beads were incubated with increasing ng amount of 1617 EV and then stained with either mouse IgG1k isotype control or EpCAM antibody. Increasing EV amount (in ng) was compared to MFI of isotype control antibody staining. C. The limit of detection (LOD) for the PDACEV antibodies as single markers and an antibody cocktail is shown in both the minimum number of particles and ng amount of EVs needed for bead-based flow.