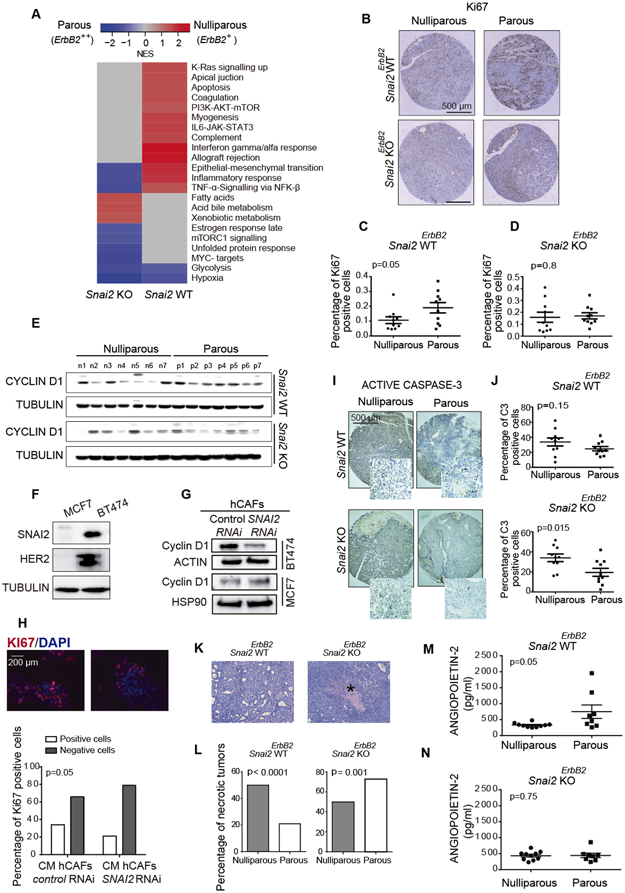
Fig. 3. Histopathological features of tumors from Snai2 WTErbB2 and Snai2 KOErbB2 mice.

(A) GSEA analysis showed different functional groups of transcripts enriched in tumors from nulliparous and parous Snai2 WTErbB2 and Snai2 KOErbB2 mice. (B) Representative images of tumor proliferation assessed by Ki-67 immunohistochemistry in a tissue-array (N = 10 mice per group). (C, D) The proportion of Ki67-positive cells was quantified in the tissue-array (Mann-Whitney U test). (E) Western blot showing CYCLIN D1 in the different groups of mice studied (N = 7 mice per group): n, nulliparous; p, parous. (F) SNAI2 and HER2 expression in MCF7 and BT474 human breast cancer cell lines assessed by immunoblots. (G) The siRNA SNAI2-depleted hCAFs were incubated with MCF7 and BT474 cells for two days, and the CYCLIN D1 expressed by the MCF7 and BT474 cells was analyzed in western blots. (H) Conditioned medium from hCAFs was used to analyze BT474 cell proliferation through the expression of the Ki67 marker (Chi-squared test). (I) Evaluation of apoptosis through active CASPASE 3 immunohistochemistry in a tissue-array (N = 10 mice per group, Mann-Whitney U test). (J) Quantification of the active CASPASE-3 labeled cells in the tissue-array shown in panel I. (K) Detail of a micronecrotic focus in a tumor from a Snai2 KOErbB2+ parous mouse indicated with an asterisk. (L) The percentage of tumors with micronecrotic foci in the different groups of mice studied (Chi-squared test). (M, N) ANGIOPOIETIN-2 expression analyzed by multiplex bead array (Luminex), 10 tumors per group were studied. Statistical significance in panels C, D, J, M, and N was evaluated using an unpaired t-test.
