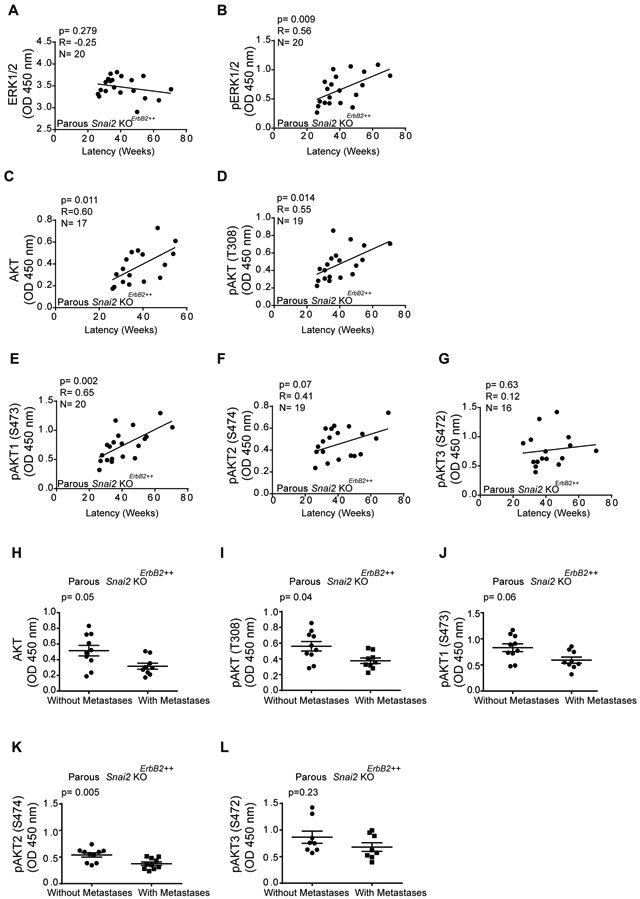
Fig. 5. Correlation between tumor levels of total and phosphorylated AKT and ERK and tumor behavior in Snai2 KOErbB2++ parous mice.

(A-G) Association between tumor latency and signaling elements in the tumor: (a) Total ERK; (B) pERK; (C) total AKT; (D) Pan-pAKT (T308); (E) pAKT1 (S473); (F) pAKT2 (S474); and (G) pAKT3 (S472). All protein isoforms were assessed by ELISA (Spearman correlation, N = 20 mice per group). See also Table S8. (H-L) Levels of pAKT isoforms in tumors from Snai2 KOErbB2++ parous mice with and without dissemination quantified by ELISA (Mann-Whitney U test, N = 10 mice per group). (H) Total AKT; (I) Pan-pAKT (T308); (J) pAKT1 (S473); (K) pAKT2 (S474); and (L) pAKT3 (S472).
