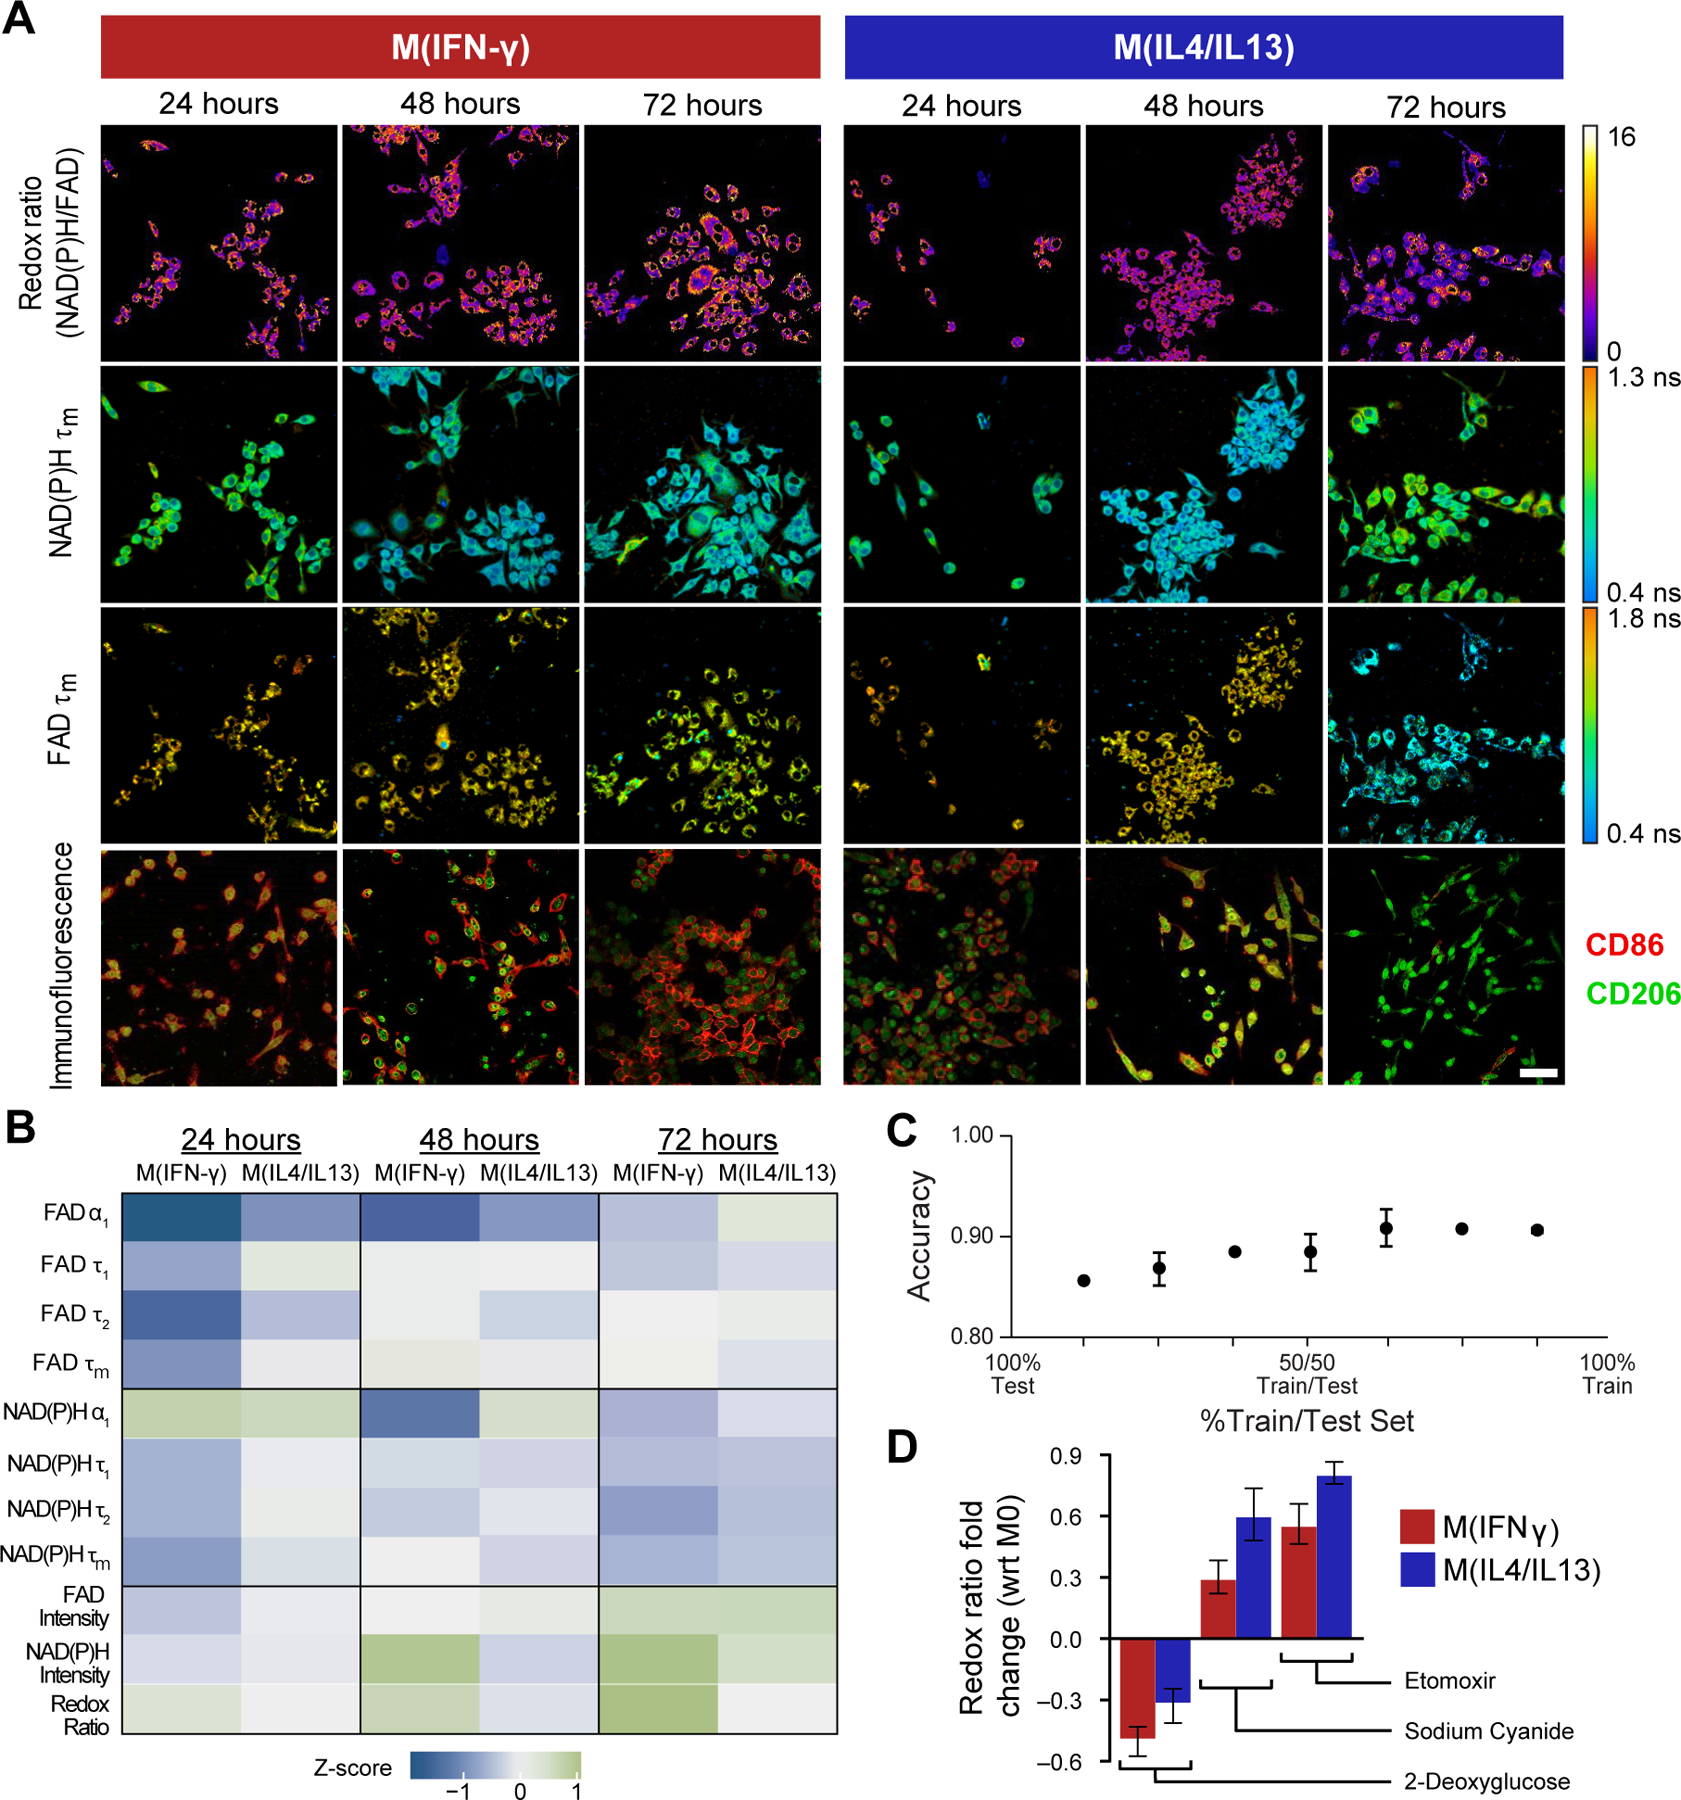
Figure 2: Metabolic autofluorescence imaging is sensitive to temporal changes in macrophage metabolism in 2D culture.

A) Representative optical redox ratio, NAD(P)H and FAD mean lifetime (τm) images of RAW 264.7 macrophages cytokine-stimulated to M(IFN-γ) (anti-tumor M1-like phenotype), M(IL4/IL13) (pro-tumor M2-like phenotype), or unstimulated (M0 naïve phenotype). Representative immunofluorescence images show surface expression of known M1-like and M2-like macrophage markers (CD86, CD206). Scale Bar = 50 μm. B) Z-score heatmaps representing metabolic autofluorescence changes of M(IFN-γ) and M(IL4/IL13) RAW264.7 mouse macrophages relative to M0 macrophages at 24, 48, or 72 hours. Z-scores are calculated as the difference between variable mean per condition and variable mean of the monoculture condition, divided by the monoculture standard deviation. C) Random forest classification accuracy of M0, M(IFNγ), and M(IL4/IL13) RAW264.7 mouse macrophages at across all timepoints (3 groups). Metabolic characterization was performed via inhibition with D) 2-deoxyglucose (2DG, glycolysis inhibitor), etomoxir (ETO, fatty acid oxidation inhibitor), and sodium cyanide (NaCN, oxidative phosphorylation inhibitor). Reported values are fold change of redox ratio with respect to M0 control under the same polarization conditions.
