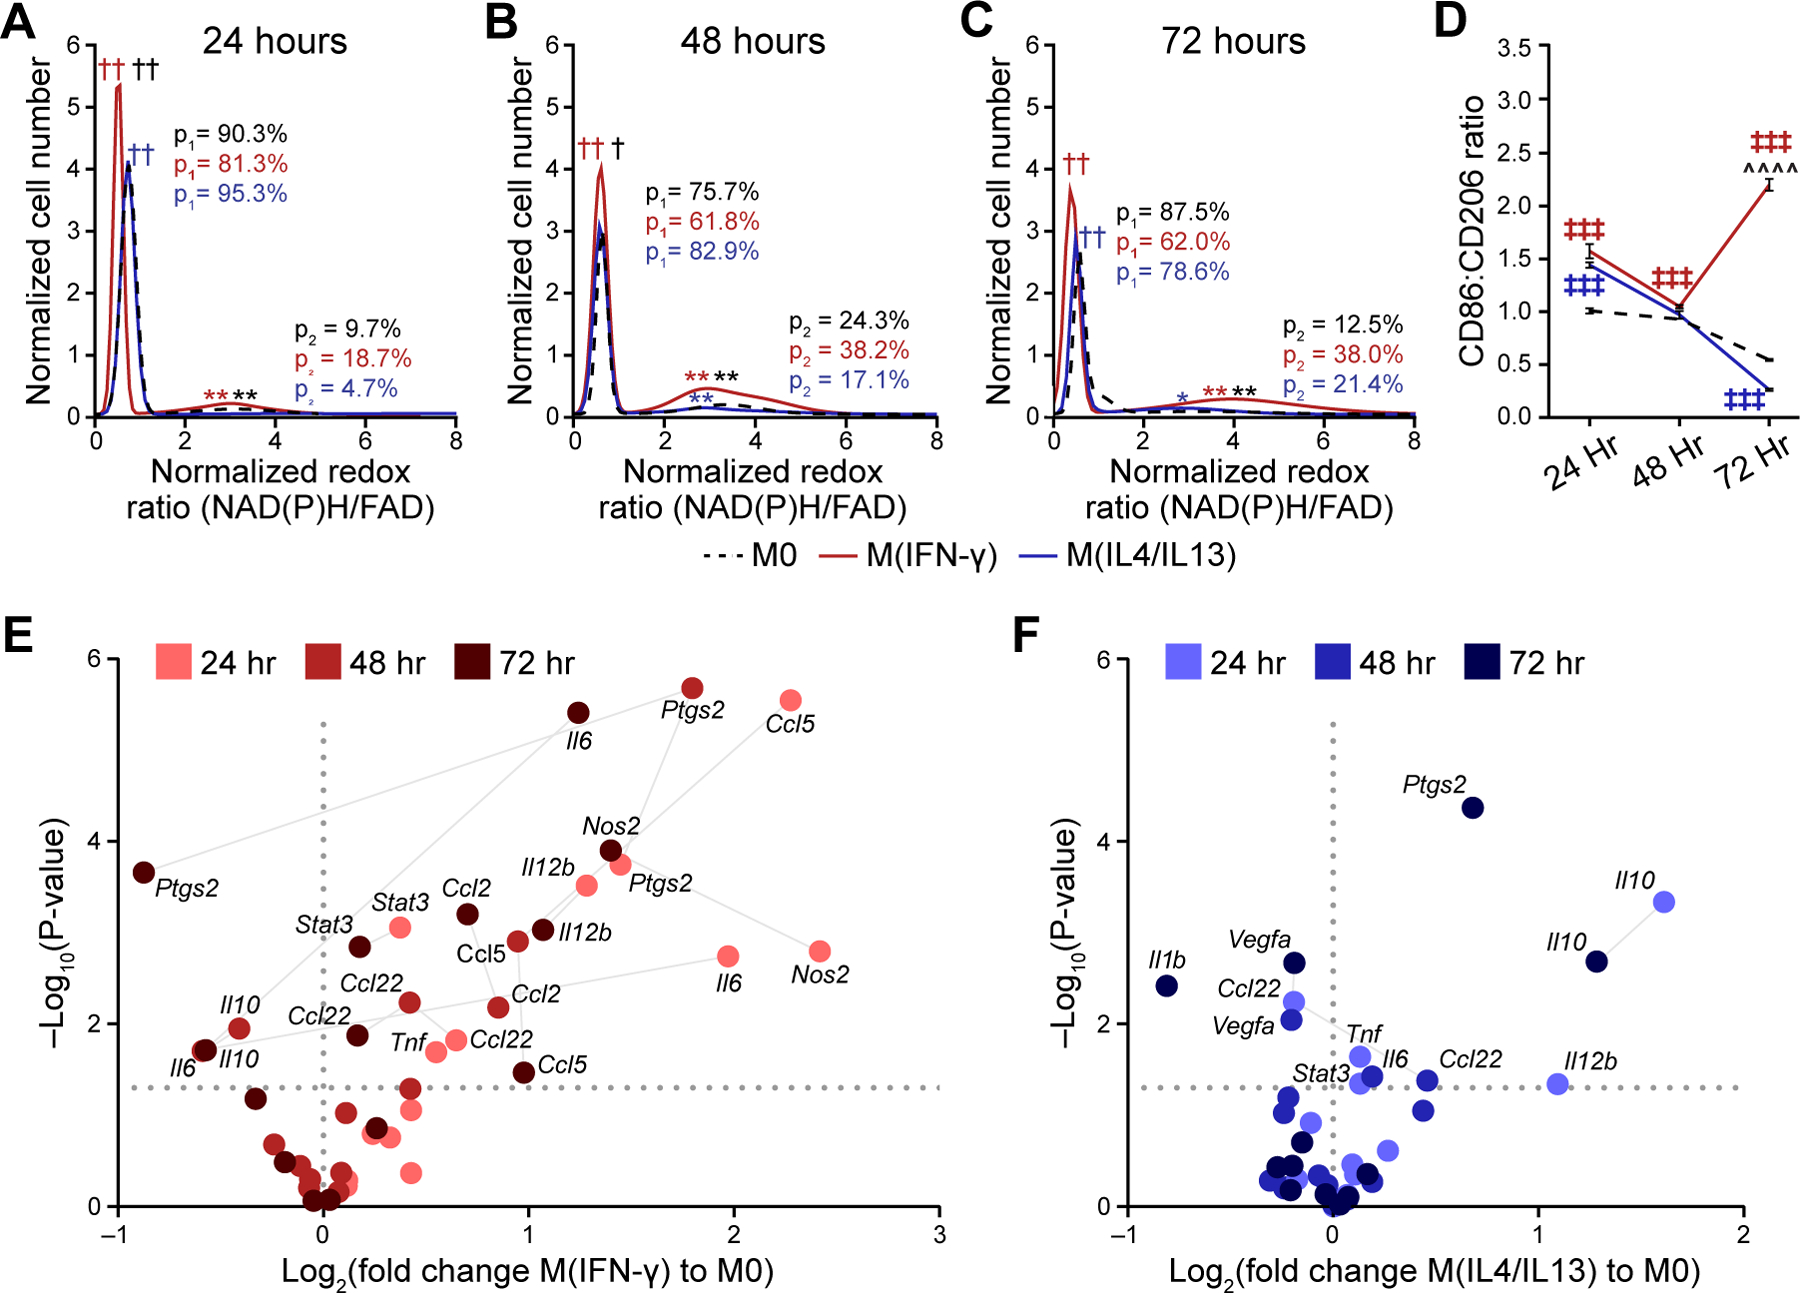
Figure 3: Metabolic autofluorescence measurements resolve metabolic heterogeneity linked to heterogeneous 2D cytokine-stimulated macrophage polarization.

Population density modeling of redox ratios per cell illustrates heterogeneous macrophage metabolism at A) 24 hours, B) 48 hours, and C) 72 hours of stimulation. Two distinct sub-populations of cell metabolism are present for each time point and stimulation condition. The proportions of the low (p1) and high (p2) redox ratio sub-populations were calculated to represent the contribution of each sub-population to the overall distribution. Cell number per time point (24/48/72 hours) – M0:1008/2153/2263 cells; M(IFN-γ):1289/999/1100 cells; M(IL4/IL13):1443/1821/2157 cells. †,†† p<0.05, 0.01 – low population; *,**p<0.05, 0.01 – high population; red – M0 vs. M(IFN-γ), blue – M0 vs. M(IL4/IL13), black – M(IFN-γ) vs. M(IL4/IL13). D) Expression levels of known M1-like and M2-like macrophage markers (CD86, CD206) were quantified for M0, M(IFN-γ), and M(IL4/IL13) macrophages at 24 hours, 48 hours and 72 hours; ╪╪╪ p<0.001, ^^^^p<0.0001. Expression levels of M1-like and M2-like genetic markers for E) M(IFN-γ), and F) M(IL4/IL13) conditions were evaluated with qPCR at 24 hours, 48 hours, and 72 hours following stimulation.
