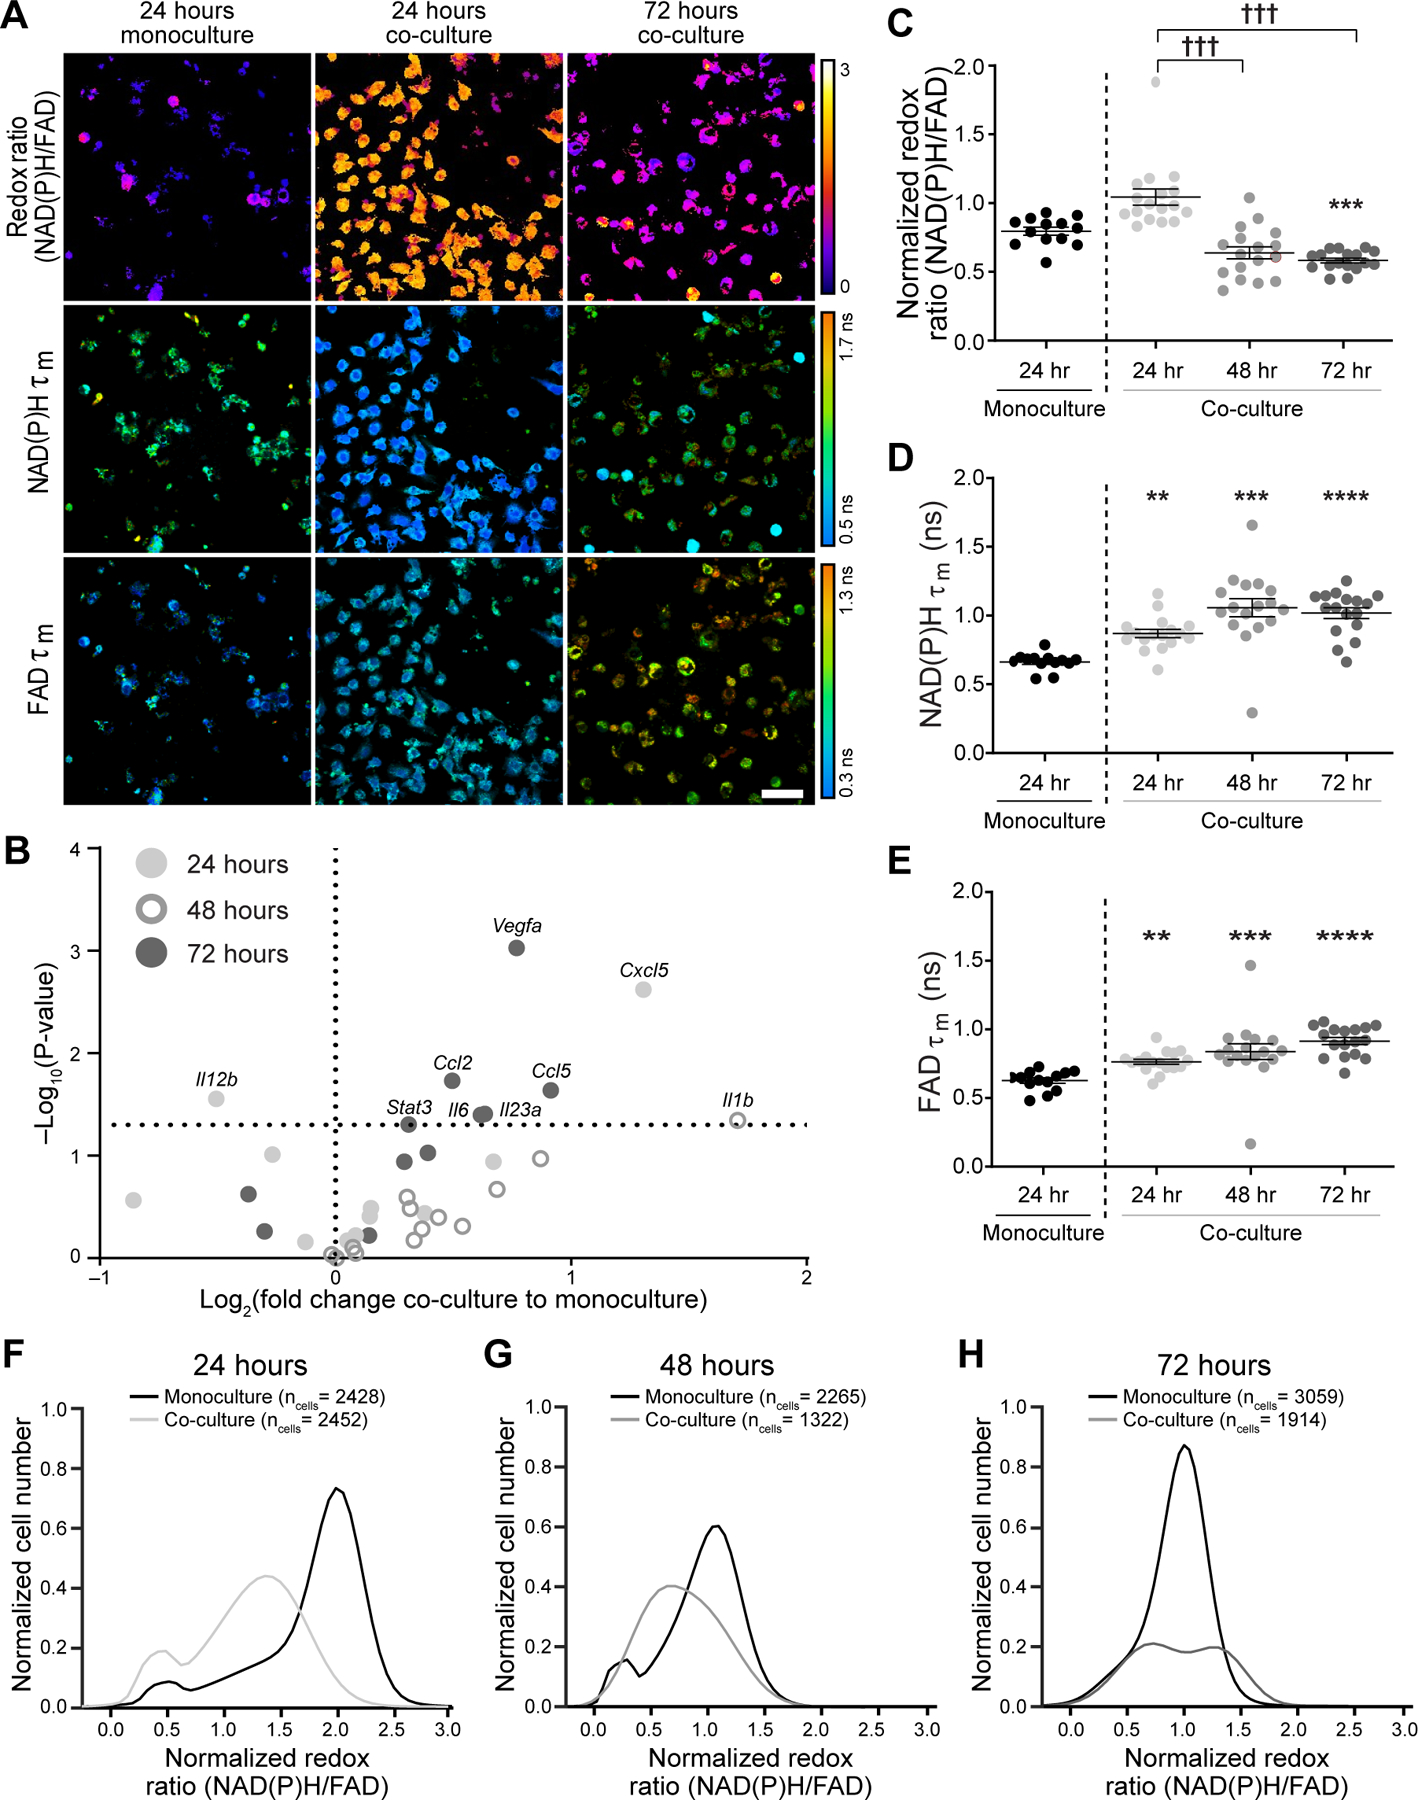
Figure 4: Metabolic autofluorescence imaging of mouse macrophages within 3D Stacks tumor co-cultures.

A) Representative autofluorescence images (z-plane distance: 6 µm) demonstrate qualitative differences in the redox ratio, NAD(P)H and FAD mean lifetimes (τm) of RAW264.7 macrophages in co-culture with PyVMT mouse mammary tumor cells. Scale bar = 50 μm. B) Gene expression levels of M1-like and M2-like markers were evaluated for monocultured and co-cultured macrophages at 24, 48, and 72 hours using qPCR. Upregulation of both M1-like and M2-like genes were observed in co-cultures by 72 hours, demonstrating heterogeneity in macrophage polarization in response to tumor stimulation. Quantitative analysis of C) redox ratio, D) NAD(P)H τm, and E) FAD τm highlight dynamic metabolic changes in macrophages during prolonged tumor-macrophage co-culture. Monocultured macrophages were not significantly different (p>0.05) across time points, so only the 24 hour monoculture is shown above. Significant differences in NAD(P)H and FAD τm are observed between monocultures and co-cultures, as early as 24 hours post-seeding. Additionally, macrophage co-cultures exhibit a gradual decline in redox ratio over time, consistent with transition to a more oxidized state; **,***,**** p<0.01,0.001,0.001 vs. monoculture, ††† p<0.001. Population density curves of single-cell redox ratios in monocultures and co-cultures at F) 24 hours, G) 48 hours, and H) 72 hours demonstrate variable cellular-level heterogeneity in co-cultured macrophages over time in monocultures.
