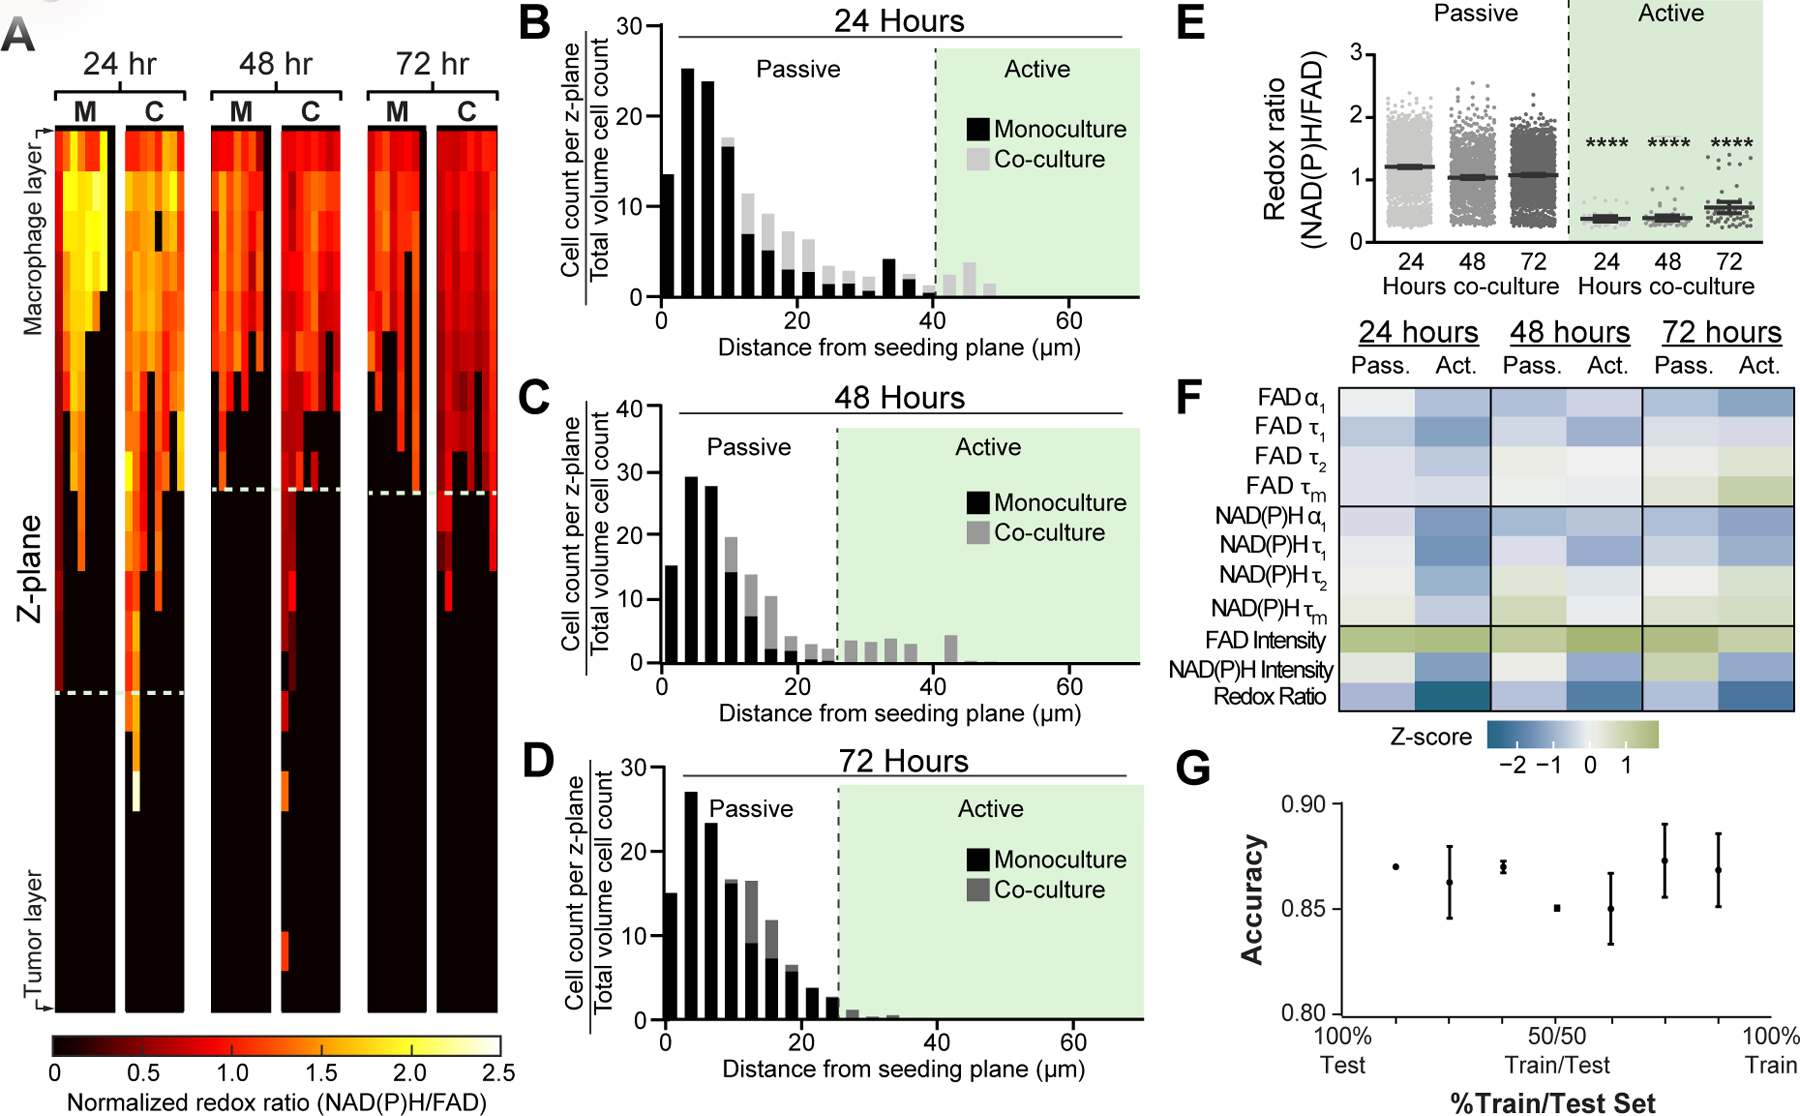
Figure 5: Microscale tumor co-cultures regulate mouse macrophage metabolism and migration over time.

A) Representative heatmaps show changes in optical redox ratio with z-plane and time within monocultured, “M”, and co-cultured, “C”, macrophages. Cell density distributions of migration distance identify a distinct subpopulation of actively-migrating RAW264.7 macrophages in the PyVMT mouse mammary tumor co-culture condition at B) 24 hours, C) 48 hours, and D) 72 hours. E) Passively- and actively- migrating macrophage populations were defined in co-cultures over 72 hours to observe time-dependent relationships between metabolic autofluorescence and migratory activity. Actively-migrating populations exhibit lower redox ratio than passive-migrating populations at all time points, suggesting macrophages undergo a metabolic switch during migration;****p<0.0001 vs passive migration. F) Z-score heatmaps representing metabolic autofluorescence changes for passive and actively-migrating RAW264.7 mouse macrophages in co-culture relative to monocultured macrophages. Z-scores are calculated as the variable mean per condition minus variable mean of the monoculture condition, divided by the monoculture standard deviation. G) Random forest classification accuracy of passive and active migration of RAW264.7 mouse macrophages in co-culture at 24, 48 and 72 hours (2 groups – Passive vs. Active).
