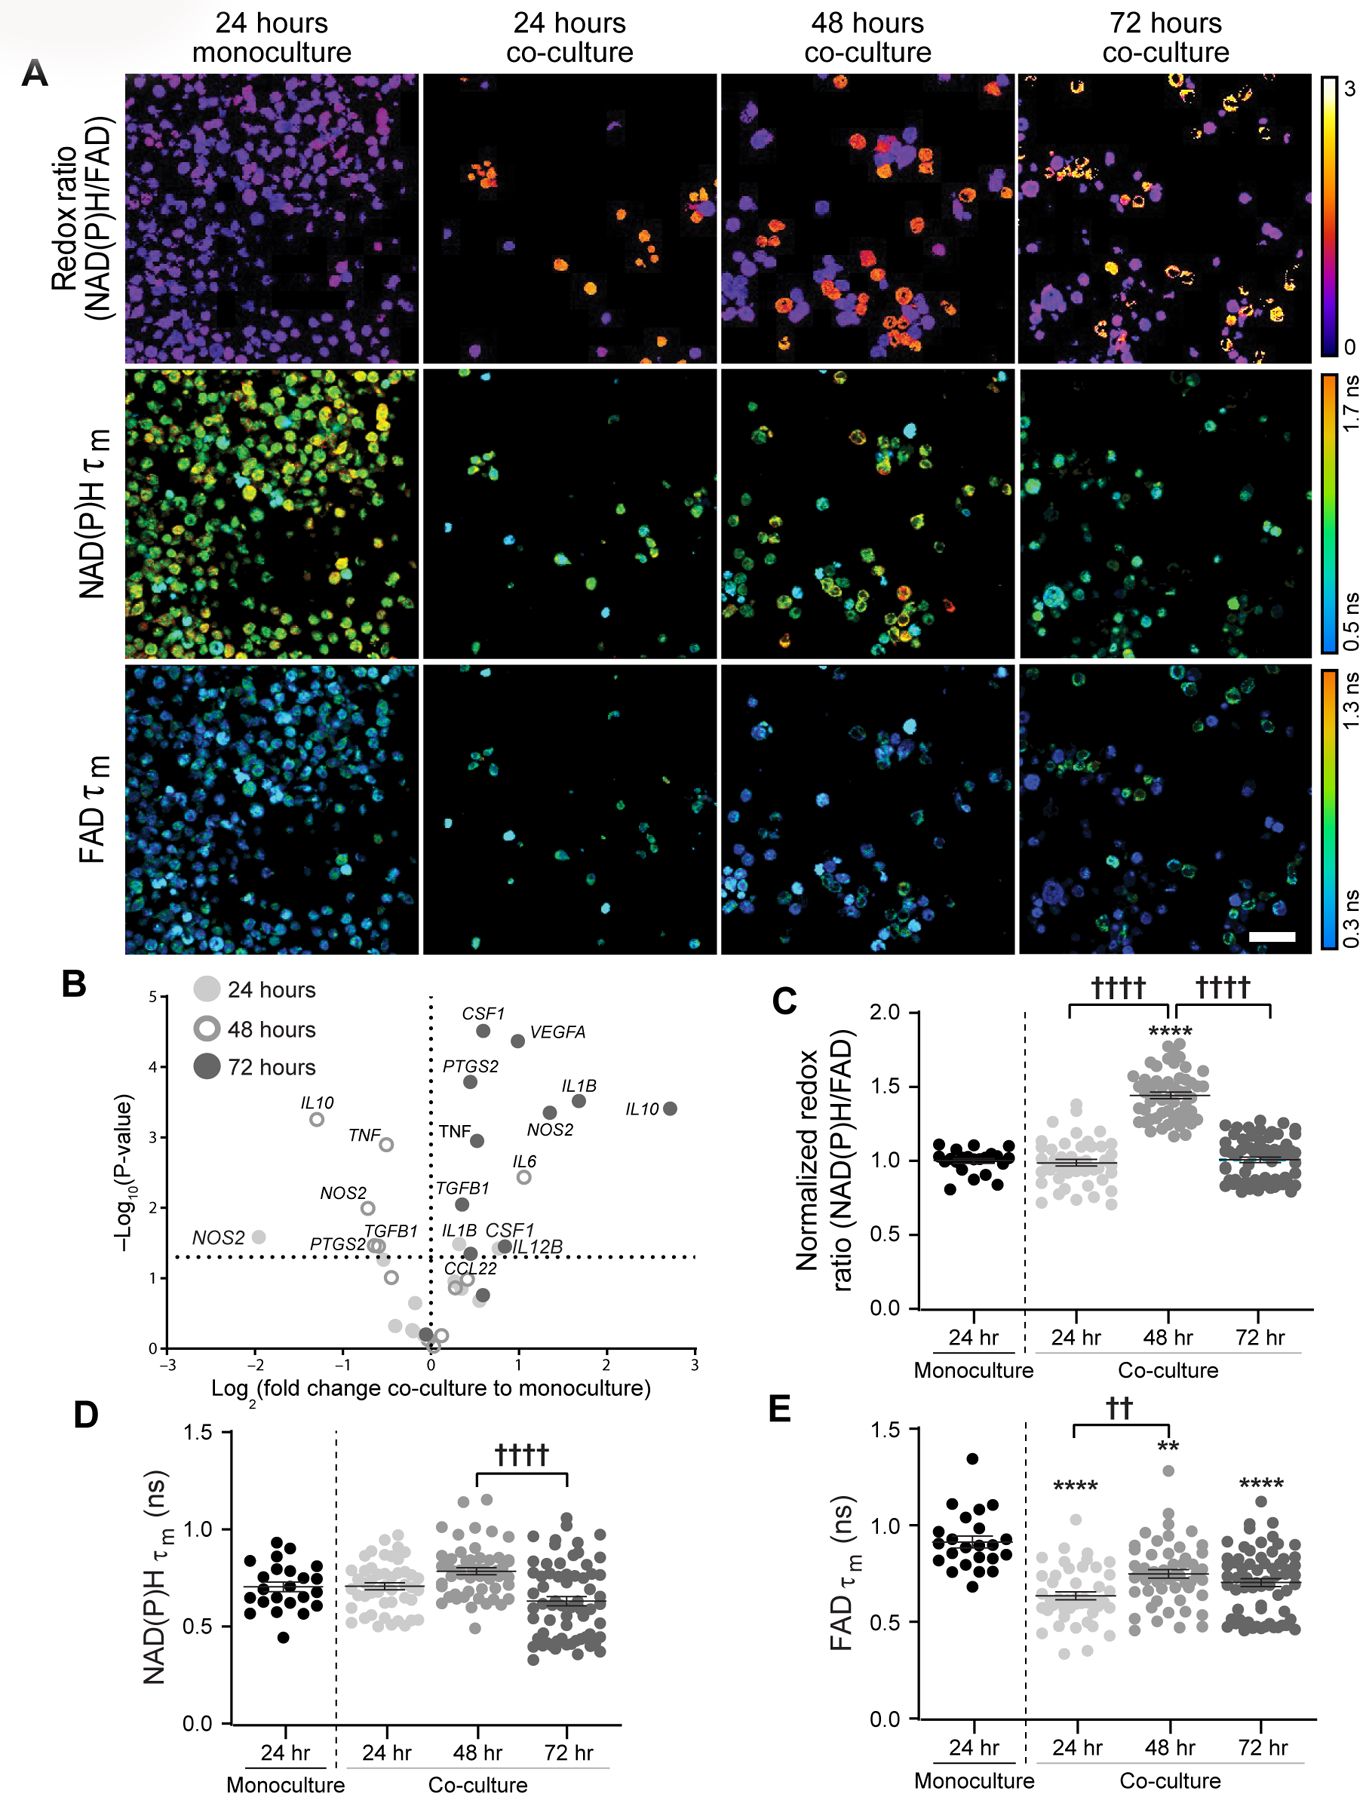
Figure 6: Metabolic autofluorescence imaging captures human monocyte-derived macrophage metabolism in 3D Stacks co-cultures with primary human invasive ductal carcinoma.

A) Representative images (z-plane distance: 12µm) display qualitative changes in redox ratio, NAD(P)H τm, and FAD τm between monoculture and co-cultures over 72 hours. Scale bar = 50 µm. B) Gene expression changes in co-cultured monocyte-derived macrophages over 24, 48, and 72 hours measured from qPCR. Changes are reported as log fold change with respect to the average of the monoculture condition for each measurement and time point. Metabolic changes in human THP-1 monocytes were quantified following co-culture with primary human IDC: C) Redox ratio, D) NAD(P)H τm, and E) FAD τm. **,**** p<0.01,0.0001 vs. monoculture; ††, †††† p<0.01,0.0001.
