
Extended Data Fig. 7.
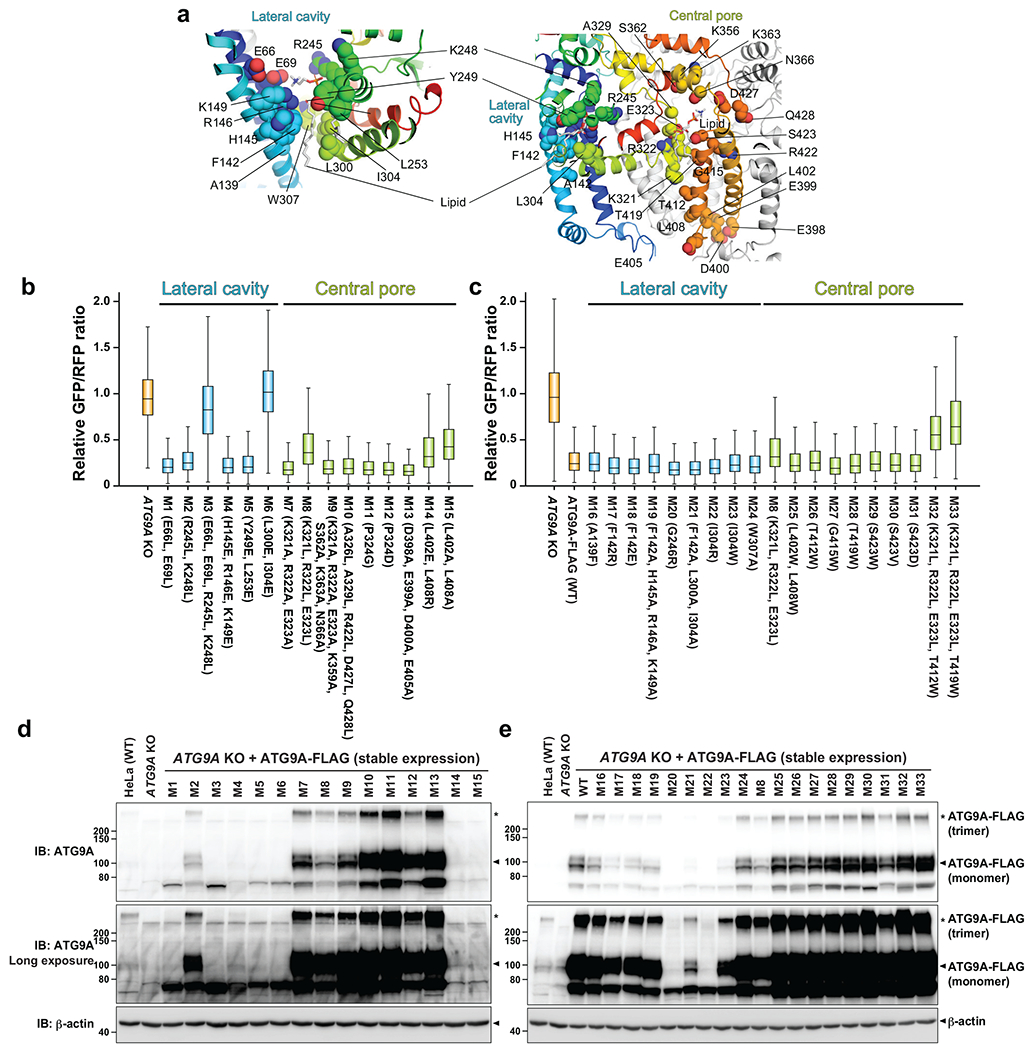
GFP-LC3-RFP autophagic flux assays with ATG9A mutants. a, Locations of the mutations on the ATG9A nanodisc structure. Hydrophilic and hydrophobic amino acids were replaced with hydrophobic and hydrophilic ones, respectively. b,c, Flow cytometry autophagy flux assays. GFP/RFP fluorescence ratios of Torin 1-streated ATG9A KO HeLa cells stably expressing GFP-LC3-mRFP and ATG9A-FLAG mutants are plotted. Data shown in (b) and (c) are the results of the first and second rounds of mutant screenings, respectively. Data of cell populations (N=4800 for b and N=2500 for c) are presented as box plots. The box limit, the horizontal line, and the whisker show the first and third quartiles, the median, and the minimum and maximum values, respectively. No outliers are shown. The assay was repeated for the mutants shown in Figure 4, and they were reproducible. The data shown in blue and green are of mutations in the lateral cavity and central pore, respectively. d,e, Western blotting of ATG9A KO HeLa cells stably expressing ATG9A-FLAG mutants. Source data for the box plots are available online.