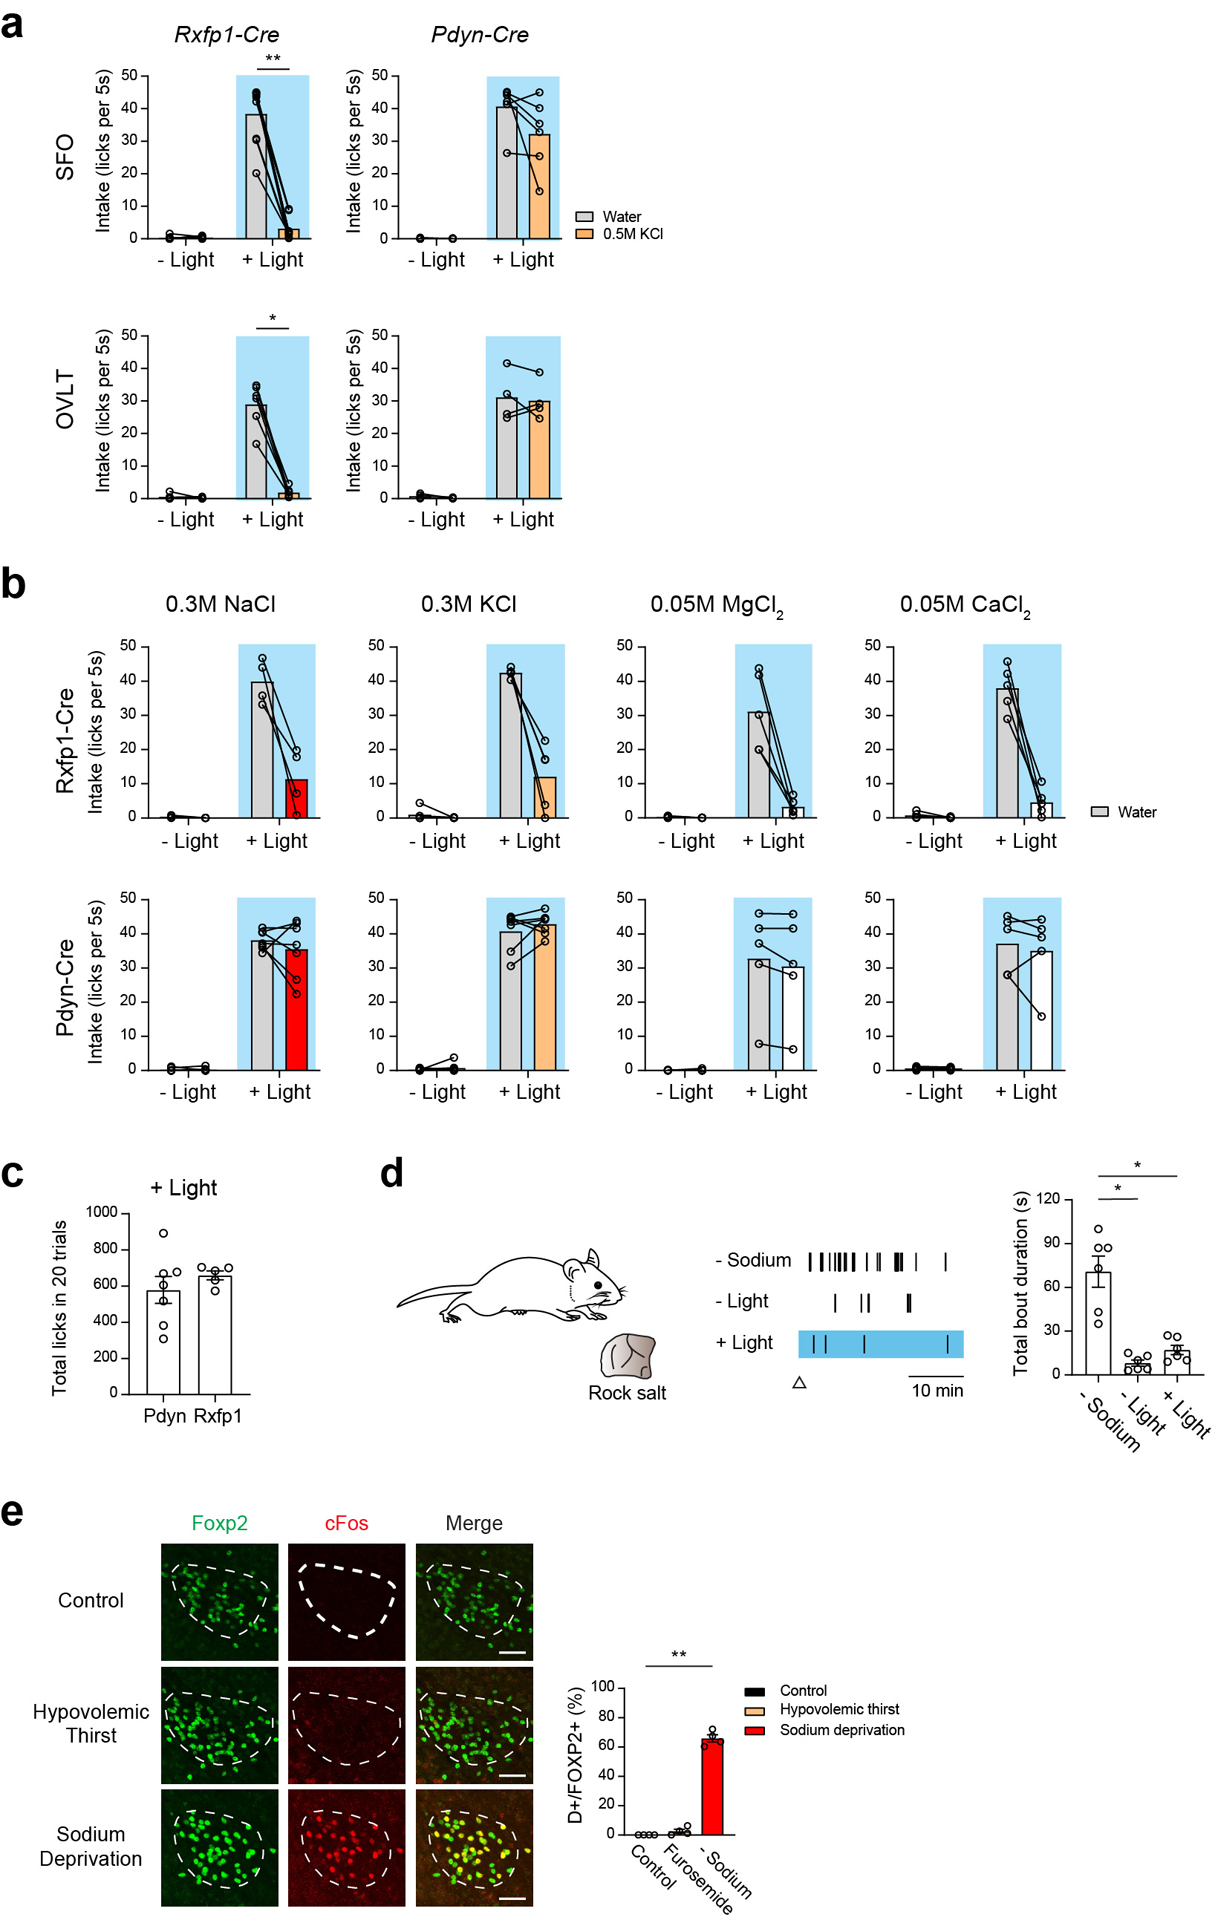
Extended Data Figure 8. Characterization of Rxfp1-Cre and Pdyn-Cre activation derived consumption phenotypes.

a, Photostimulation of Rxfp1 neurons in the SFO triggered robust drinking preference to pure water (middle panel, n = 9 mice), while photostimulation of SFOPdyn neurons induced indiscriminate intake of both water and 0.5 M KCl (n = 6 mice). We observed similar preference in OVLT neurons (n = 6 mice for Rxfp1-Cre, and n = 4 mice for Pdyn-Cre). b, Drinking patterns of Rxfp1-Cre and Pdyn-Cre animals to different concentrations and various salts. Photoactivation of SFORxfp1 induced robust pure water drinking, while the same animal avoided NaCl (0.3 M, n = 4 mice), KCl (0.3 M, n = 5 mice), MgCl2 (0.05 M, n = 5) and CaCl2 (0.05M, n = 5). Animals that receive stimulation in SFOPdyn neurons accepted all of the above solutions (n = 7 mice for NaCl and KCl, 5 mice for MgCl2 and CaCl2). c, Photostimulation of SFOPdyn and SFORxfp1 neurons triggered comparable total fluid intake (n = 7 mice for SFOPdyn, n = 5 mice for SFORxfp1). The total lick number over 20 trials was quantified. d, Photostimulation of SFOPdyn neurons did not drive sodium-licking behavior (n = 6 animals). Schematic of rock salt behavior test (left). Representative salt licking raster plots under sodium deprivation (-Sodium), sated (- Light) and photostimulation (+ Light) are presented (middle). Triangle marks the start time of recording. The total bout duration is quantified (right). e, Hypovolemic stress failed to activate sodium appetite neurons in Pre-LC. Representative images of c-Fos (red) and Foxp2 expression (a genetic marker for sodium appetite neurons, green) under sated (Control), hypovolemic thirst (Furosemide) and sodium deprived conditions (Sodium deprivation). Quantification shows percentage of activated sodium appetite neurons (double positive / Foxp2 positive neurons, right, n = 4 mice per group). Scale bar, 50 μm. * p < 0.05, ** p < 0.01, *** p < 0.001, **** p < 0.0001, by two-tailed Wilcoxon matched-pairs signed rank test, Mann-Whitney test, Friedman test or Kruskal-Wallis test followed by a Dunn’s post test. Data are shown as mean ± s.e.m.
