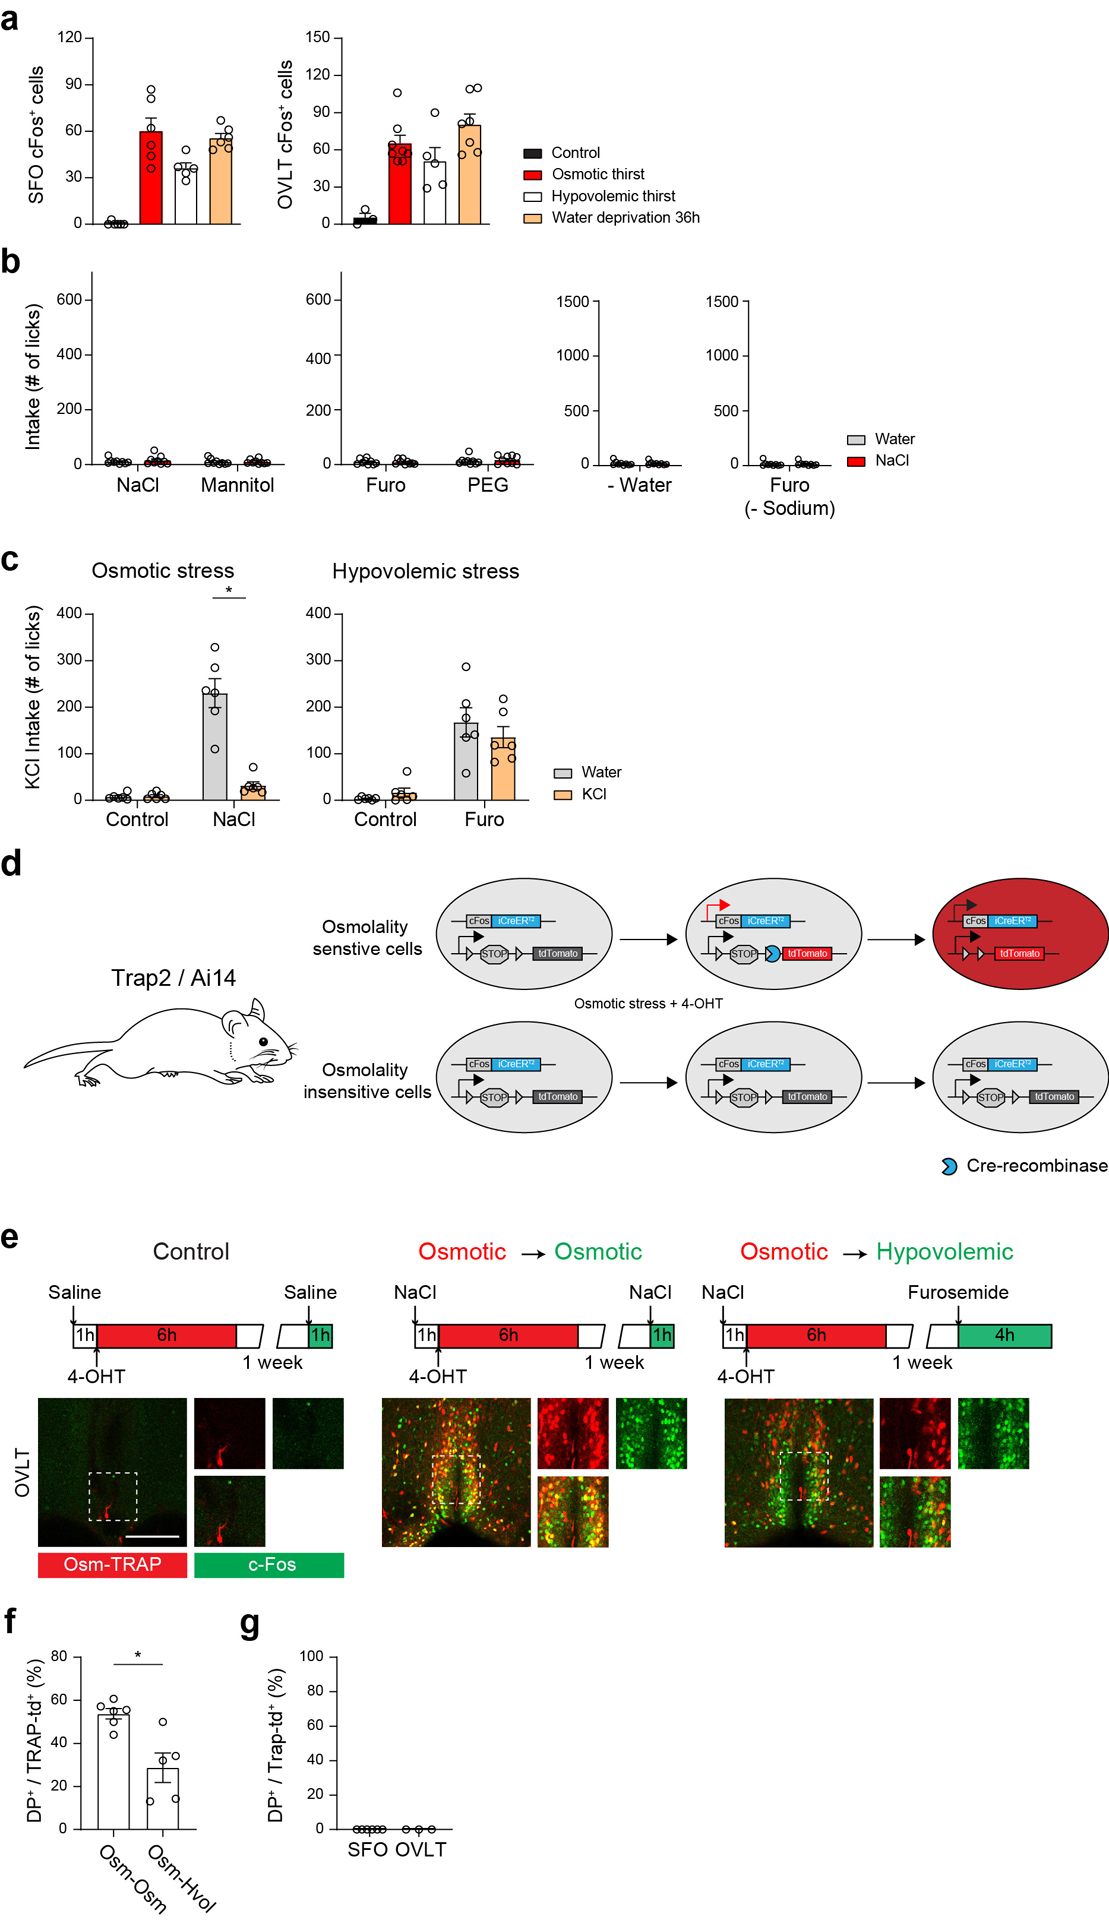
Extended Data Figure 1. Thirst-state-dependent drinking behavior and genetic labeling of active neurons.

a, c-Fos expression in the SFO (left) and OVLT (right) under the five conditions (SFO: n = 6 mice for control, osmotic thirst, and water deprivation 36 hours, 5 for hypovolemic thirst; OVLT: n = 3 for control, 8 for osmotic thirst, 5 for hypovolemic thirst, 7 for water deprivation 36 hours). b, Water and 0.3M NaCl consumption in sated control animals. The number of total licks for water (grey) and 0.3M saline (red) were quantified during a one-hour session (n = 9 mice for each group). c, Water (grey) and 0.3M KCl intake (orange) under osmotic and hypovolemic thirst states. The number of total licks was quantified during a one-hour session (n = 6 mice). d, Experimental diagram for TRAP2 activity-dependent genetic labeling. TRAP2/Ai14 double transgenic animals were challenged with osmotic stress by i.p. injection of NaCl solution in the presence of 4-hydroxytamoxifen (4-OHT). Osmolality sensitive cells (upper) express Cre-ER under the promoter of c-Fos gene, which turns on tdTomato expression (red). In osmolality insensitive cells, the same stimulus does not induce tdTomato expression (bottom). e, Genetic labeling of thirst-sensitive neurons in the OVLT of TRAP2/Ai14 mice. Experimental design to label activated neurons under osmotic thirst and hypovolemic thirst (top). Osmolality sensitive neurons (Osm-TRAP, red) in the OVLT (bottom) overlapped with NaCl-induced acute c-Fos expression (green). Individual labeling and merged images are shown. By contrast, a significantly smaller fraction of Osm-TRAP neurons was co-labeled with hypovolemia-induced c-Fos. Scale bars, 50 μm. f, Quantification of OVLT TRAP2 experiments (n = 6 from 4 mice for Osm-Osm, n = 5 from 4 mice for Osm-Hvol). g, TRAP labeling in the SFO and OVLT of sated control animals (n = 6 from 3 mice for SFO, n = 3 from 2 mice for OVLT). * p < 0.05, ** p < 0.01, *** p < 0.001 by two-tailed Wilcoxon matched-pairs signed rank test or Mann-Whitney test. Data are shown as mean ± s.e.m.
