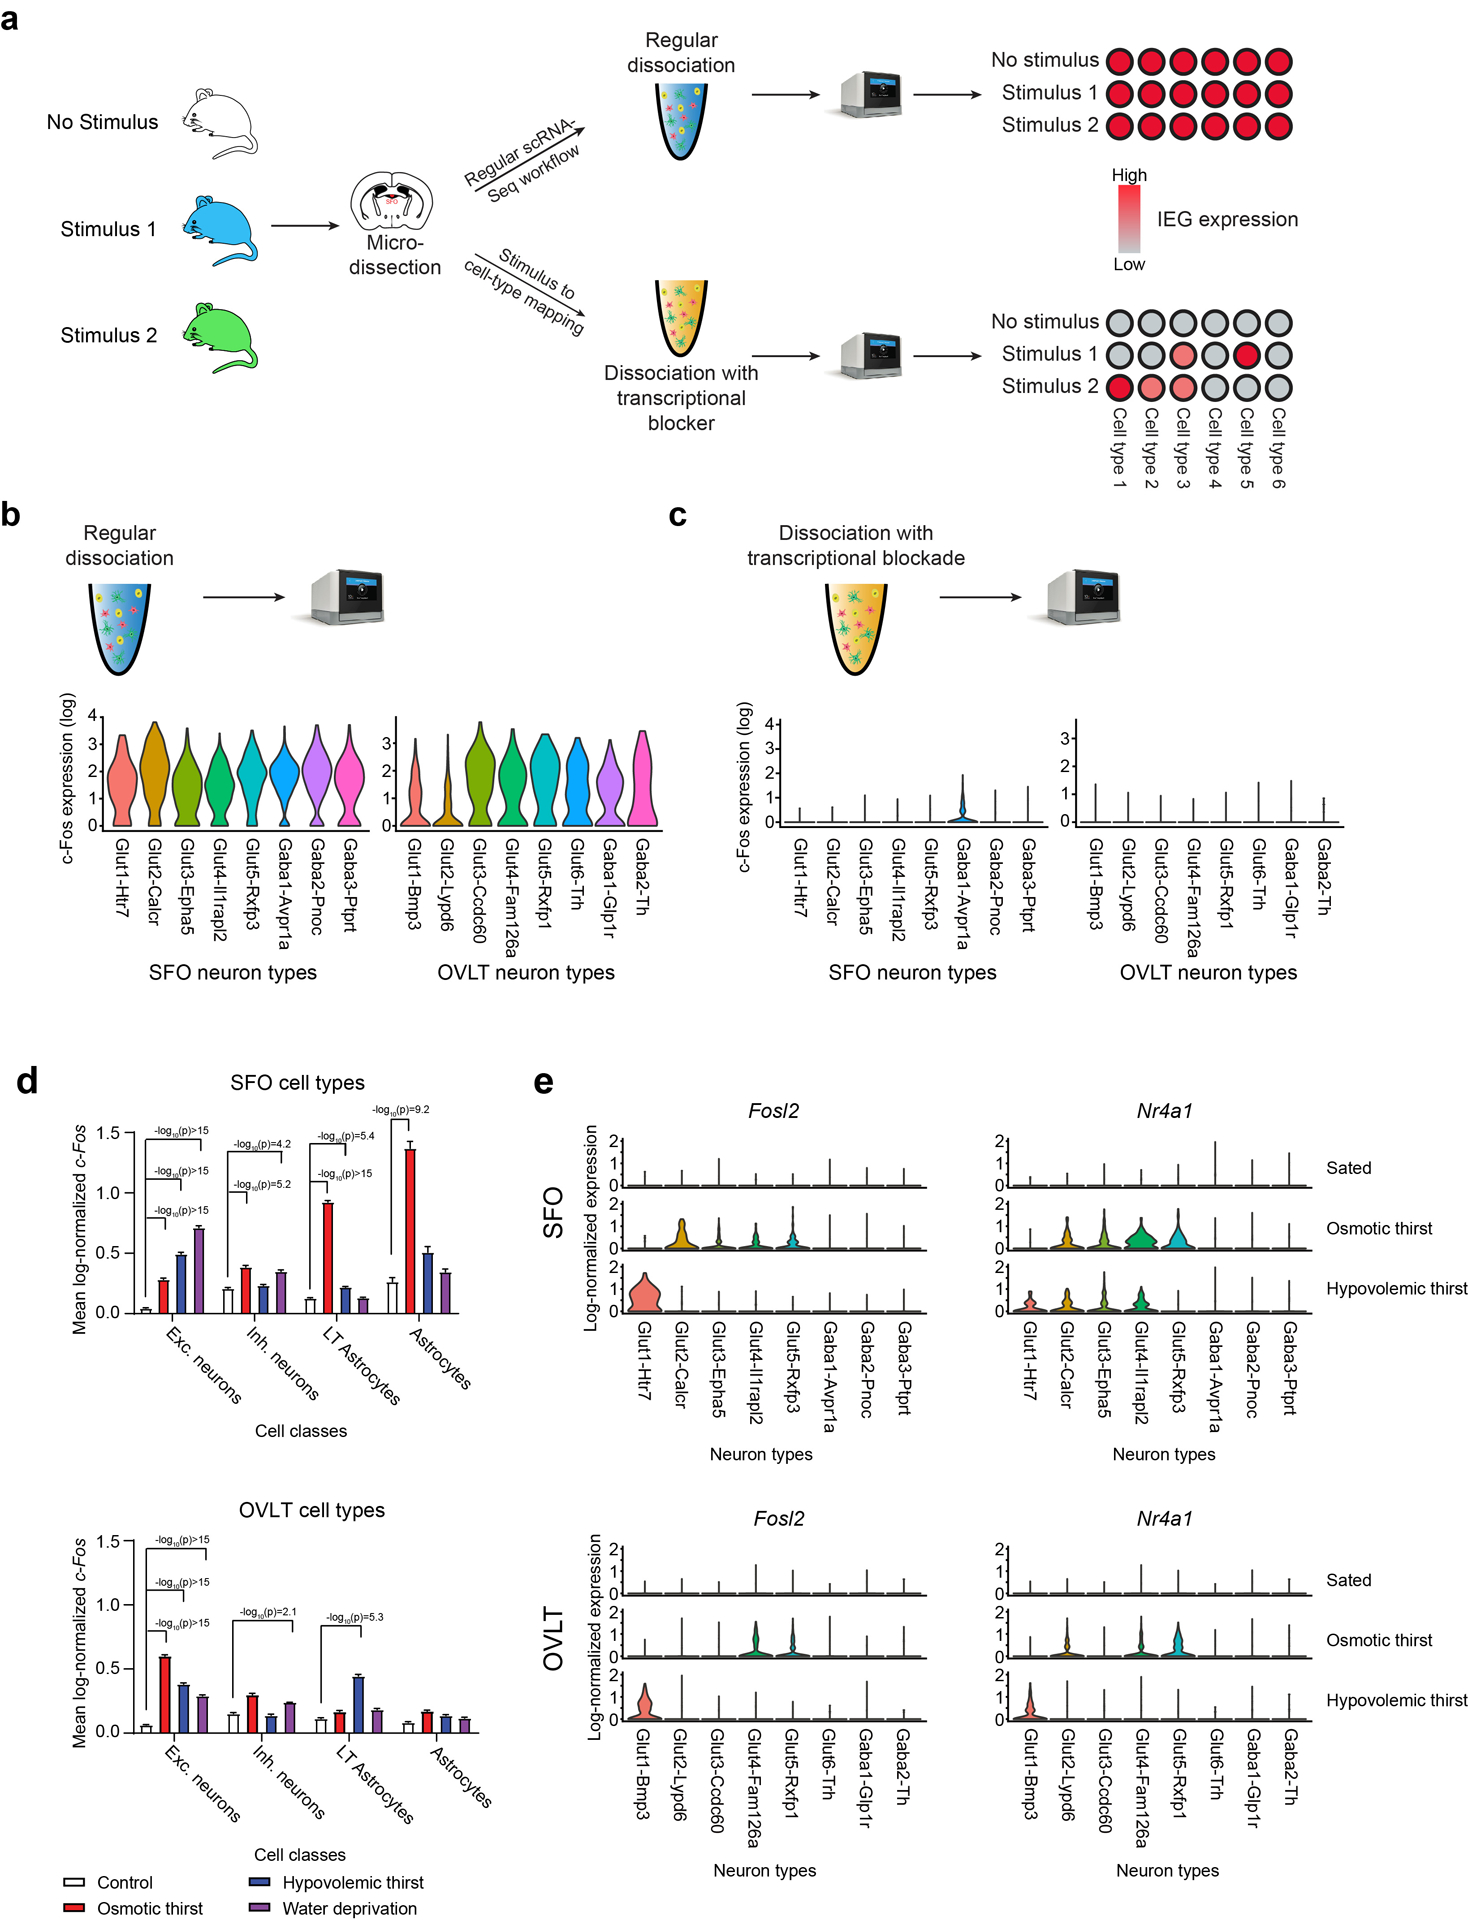
Extended Data Figure 4. Stimulus to cell-type mapping in SFO and OVLT.

a, A diagram of scRNA-seq-based stimulus to cell-type mapping protocol. As previously reported, regular scRNA-seq results in artificial induction of IEGs in all neuron types stemming from tissue dissociation21,22. Performing scRNA-seq with a transcriptional blocker during tissue dissociation suppresses artificial induction of IEGs revealing the stimulus or behavior induced IEG expression pattern. b, Regular scRNA-seq induces high levels of c-Fos expression in all SFO and OVLT neuron types. Data are shown as a violin plot of log-normalized c-Fos transcript count data. c, In the presence of actinomycin D, artificial induction of IEGs in non-stimulated SFO and OVLT neurons is abolished. Images were provided by 10x Genomics. d, Expression of c-Fos in SFO and OVLT major cell classes under distinct thirst states (SFO excitatory neurons n = 931, 689, 775, 706; SFO inhibitory neurons n = 935, 714, 997, 793; SFO LT astrocytes n = 2085, 1907, 2544, 3177; SFO astrocytes n = 110, 138, 97, 265; OVLT excitatory neurons n = 2623, 3027, 2115, 2489; OVLT inhibitory neurons n = 853, 831, 661, 773; OVLT LT astrocytes n = 1229, 1087, 1133, 1238; OVLT astrocytes n = 1736, 1225, 1384, 1353). Data are shown as mean ± s.e.m. e, Expression of other IEGs (Nr4a1 and Fosl2) in SFO and OVLT neuron types under distinct thirst states. All data were analyzed with two-tailed Kruskal-Wallis test with Dunn’s post test. P -values are shown on a log10(p) scale.
