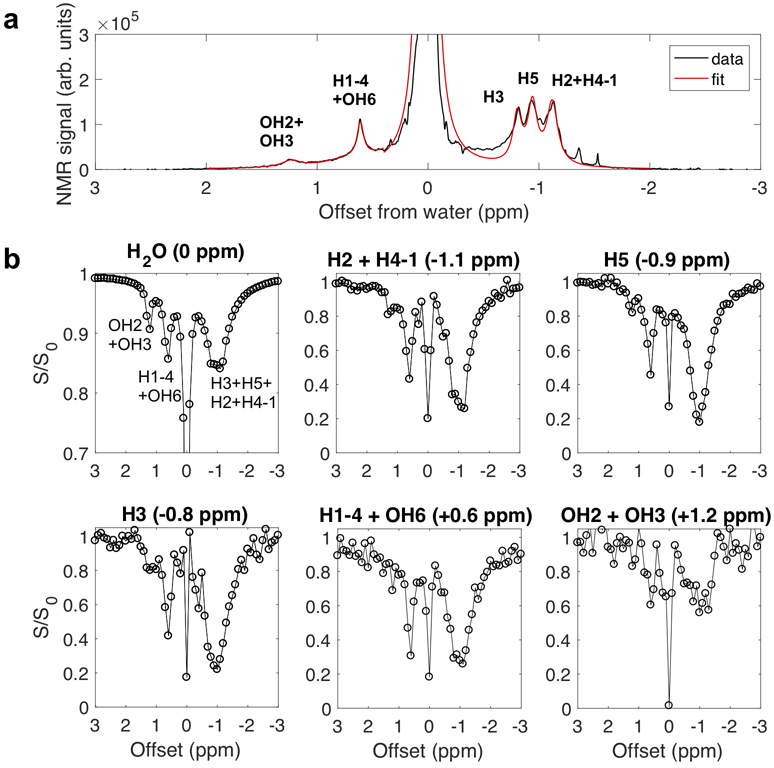
Figure 5.

Coupling of different proton groups in oyster glycogen (100 mM) in 95% D2O/5% H2O at pH 6.4. (a) A representative proton NMR spectrum with Lorentzian line-shape fitting to quantify the peak intensities of the six pools. (b) Z-spectra for the six proton pools assigned in (a), i.e. a plot of intensities relative to the full signal of the particular proton group plotted as a function of saturation frequency. In the absence of coupling between pools, only the direct saturation peak for a particular pool would be visible.
