
Figure 6.
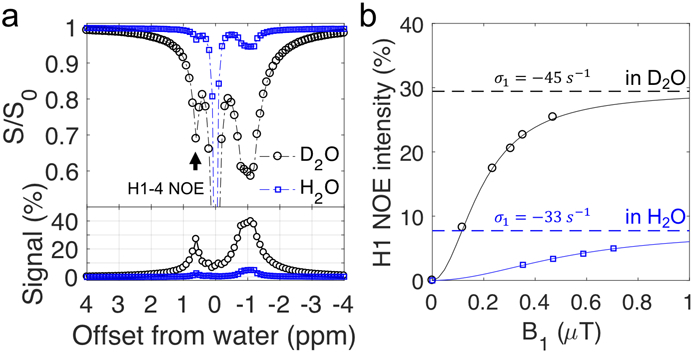
Oyster glycogen (pH 9.6) in H2O and D2O. (a) The Z-spectra (B1 = 0.4 μT) of glycogen (100 mM, pH 9.6) in H2O (95% H2O/5% D2O) and D2O (95% D2O/5% H2O). The bottom panel shows the magnetization transfer difference signal of these Z-spectra after removing the direct water saturation background. (b) The H1-4 NOE peak (+0.6 ppm) intensity as a function of B1 saturation power. The H1-4 NOE rates (σ1) were fitted according to Eqs. 4 and 7 and assuming the slow tumbling limit ().