
Figure 1. Inhibition of PI3K/mTOR induces synergistic cytotoxic effects with a CHK1 inhibitor by causing DNA damage and cell apoptosis.
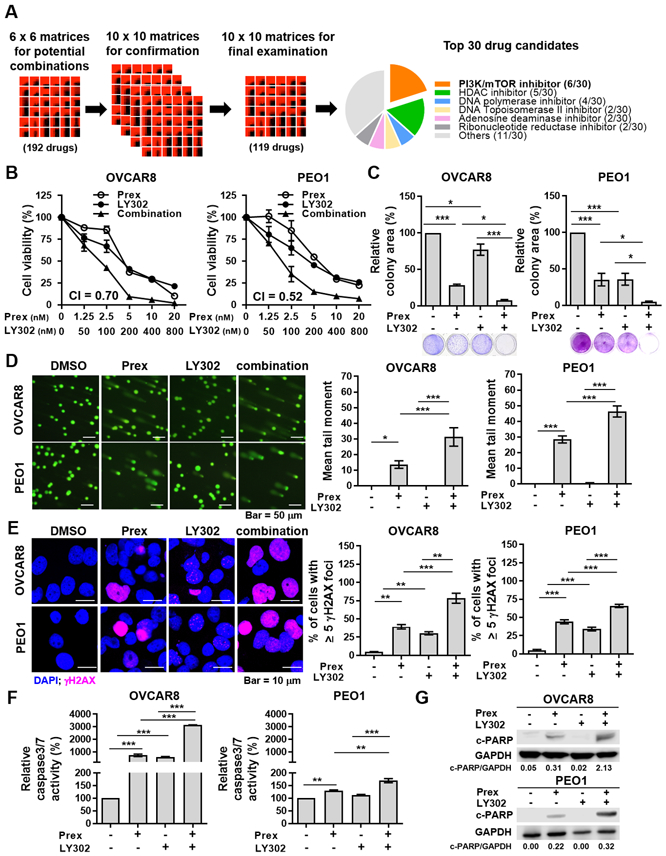
A, The workflow of drug combination screen in BRCA wild-type (BRCAwt, OVCAR5, OVCAR8 and PEO4) and BRCA2 mutant (BRCA2m, PEO1) HGSOC cells. 20% of top 30 drugs that showed synergistic cytotoxic effects with a CHK1 inhibitor prexasertib (Prex) were PI3K/mTOR pathway inhibitors. B, Cell viability was examined using XTT assay. Cells were treated with Prex, PI3K/mTOR inhibitor LY3023414 (LY302) or in combination at indicated doses for 72 hours. The combination index (CI) quantitatively depicts synergism (CI < 1). C, Cells were seeded at low density and treated with Prex (5 nM) and/or LY302 (200 nM) grown for 7 days in normal serum medium. Colonies were visualized by 0.01% (w/v) crystal violet staining. Quantification was performed by ImageJ software with ColonyArea plugin. D, Cells were treated with Prex (5 nM) and/or LY302 (200 nM) for 48 hours. DNA damage was examined by alkaline comet assay. At least 100 cells events in each treatment were quantified using CometScore© software. Representative images are shown (left) and the mean tail moment which considers both the migration of the genetic material as well as the relative amount of DNA is plotted (right). Scale bar is 50 μm. E, Cells were assessed by staining for γH2AX foci (pink) and confocal immunofluorescence imaging. Cell nuclei were stained with DAPI (blue). Representative images were taken at x 63 magnification and scale bar is 10 μm (left). The percentage of cells with ≥ 5 γH2AX foci representing cells with DNA damage is plotted (right). F-G, Cell apoptosis effect was assessed by caspases 3/7 activity assay (F) and Western blotting of cleaved PARP (c-PARP) and GAPDH (G). Densitometric values of c-PARP relative to GAPDH are shown. All data are shown as mean ± SD. *, p < 0.05; **, p < 0.01; ***, p < 0.001.