
Figure 2. Inhibition of PI3K/mTOR pathway increases CHK1 inhibitor-induced chromosome breaks and mitotic cell death in HGSOC cells.
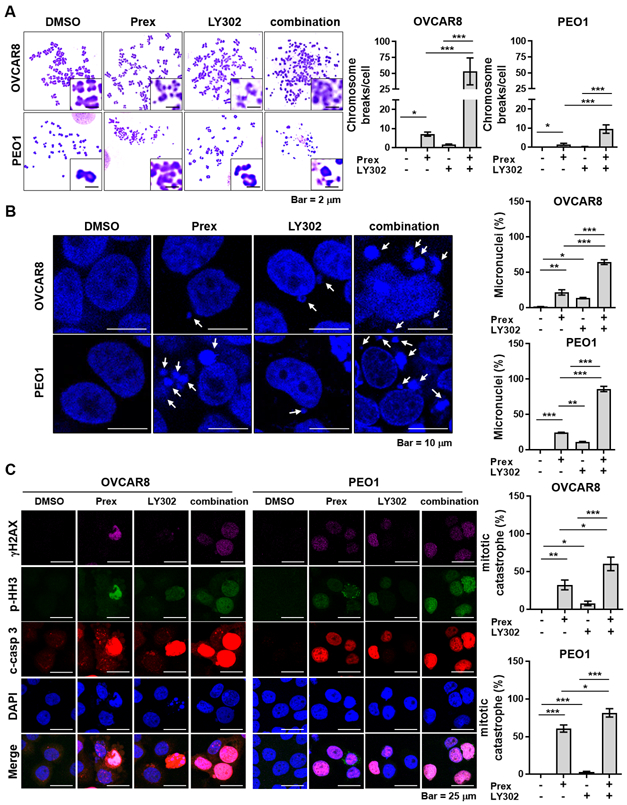
A, Cells were treated with prexasertib (Prex, 5 nM) and/or LY3023414 (LY302, 200 nM) for 48 hours in the presence of 20 μM zVAD pan-caspase inhibitor to exclude apoptosis-driven DNA fragmentation. Metaphase spreads were prepared as described in Supplementary Methods. A total of 35 metaphases were analyzed from each sample. Representative images of metaphase spreads are shown (left). Chromosomal breaks and fusions under each condition are plotted (right). Scale bar is 2 μm. B, Cells were treated with Prex (5 nM) and/or LY302 (200 nM) for 48 hours. Representative images of cells with micronuclei are shown (arrowheads, left). Percentage of cells containing micronuclei are plotted (right). Scale bar is 10 μm. At least ten field images were counted (> 100 cells). C, Cells were treated with Prex (5 nM) and/or LY302 (200 nM) for 48 hours. The DNA double-stranded break marker γH2AX (pink), mitotic marker phosphorylated histone H3 (p-HH3; green) and apoptosis marker cleaved caspase 3 (c-casp 3; red) were analyzed by immunofluorescence (left). Scale bar is 25 μm. Quantification of triple-positive cells as mitotic catastrophe was performed by ImageJ software and plotted (right). All data are shown as mean ± SD. *, p < 0.05; **, p < 0.01; ***, p < 0.001.