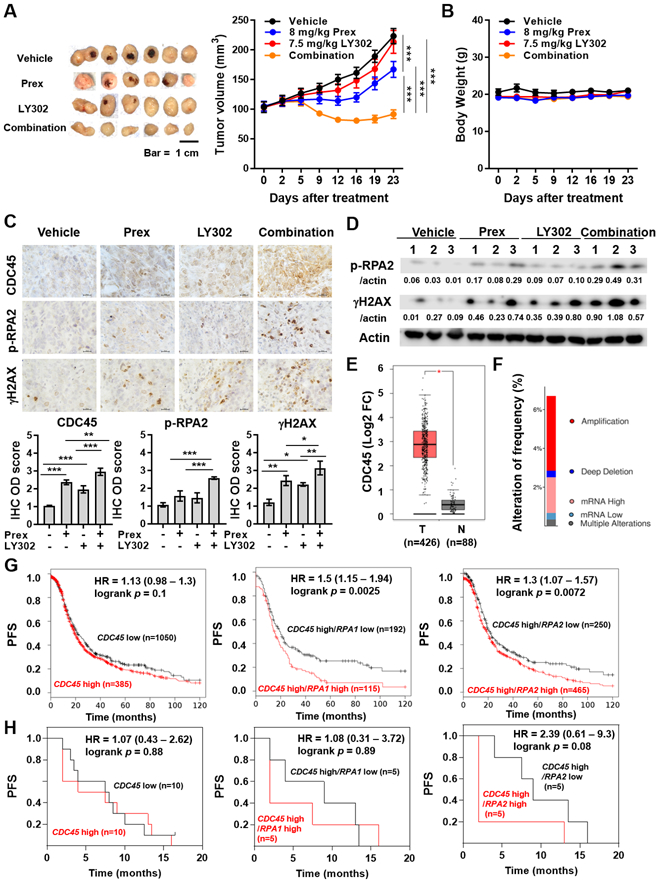
Figure 6. Dual inhibition of PI3K/mTOR and CHK1 suppresses tumor growth accompanied by high levels of replication stress in vivo and CDC45 combined with replication stress markers shows potential prognostic impacts in patients with ovarian cancer.

A-B, Combination efficacy of prexasertib (Prex) with LY3023414 (LY302) on tumor growth in OVCAR8 HGSOC xenograft tumors. Dosing schedules are described in Methods. Tumor volume (A) and body weight (B) are plotted. Scale bar is 1 cm. Data are shown as mean ± SEM. ***, p < 0.001. C-D, Tumor tissues from A were collected. C, Representative IHC results for CDC45, p-RPA2 (S4/S8) and γH2AX. All images were taken at x 60 magnification and scale bar is 20 μm (top). Quantification was performed by ImageJ software with IHC Profiler plugin as described in Methods. The IHC optical density (OD) scores of nuclear CDC45, replication stress marker p-RPA2 (S4/S8) and DSBs marker γH2AX are plotted (bottom). Data are shown as mean ± SD. *, p < 0.05; **, p < 0.01; ***, p < 0.001. D, Immunoblotting results and densitometric values of p-RPA2 (S4/S8) and γH2AX relative to β-actin are shown. E, The boxplots present the expression of CDC45 in serous ovarian cancer tissues and normal ovary tissue were produced by the Gene Expression Profiling Interactive Analysis online platform (GEPIA, http://gepia.cancer-pku.cn). *, p < 0.05. F, The alteration frequency of CDC45 in patients with serous ovarian cancer from The Cancer Genome Atlas (TCGA, Firehose Legacy) was determined using cBioPortal (http://www.cbioportal.org). The alteration frequency included amplification (red), deep deletion (blue), mRNA high (pink), mRNA low (benzo blue) and multiple alterations (gray). G, The prognostic value of CDC45 was obtained from Kaplan-Meier plotter (KM plotter, http://kmplot.com/analysis/) [ovarian cancer] databases. Ovarian cancer patients with high CDC45 levels (n=1,050) and low CDC45 levels (n=385) were divided using auto select best cutoff shown on the website (left). Patients with high CDC45 levels were further divided into high- and low-expression groups based on the median expression of RPA1 (middle) or RPA2 (right) using multiple genes analysis. The PFS of ovarian cancer patients during 120-month follow-up was analyzed by KM plotter website, and the hazard ratio with 95% confidence intervals and logrank p values were calculated. H, RNA-seq datasets were performed using pretreatment biopsy samples from 20 recurrent HGSOC patients (5). According to the median expression of CDC45, HGSOC patients were divided into high- (n=10) and low-expression (n=10) groups (left). HGSOC patients with high CDC45 levels were further divided into high- and low-expression groups of RPA1 (middle) or RPA2 (right) based on their median expression levels.
