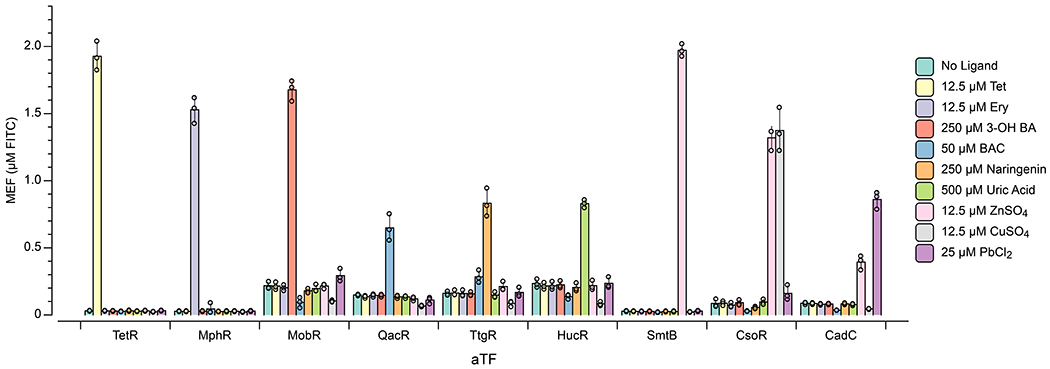
Extended Data Fig. 5 |.

The corresponding bar graph data of the orthogonality matrix shown in Fig. 4a are presented. All data shown for n=3 independent biological replicates as points with raw fluorescence values standardized to MEF (µM FITC), and bars representing averages of replicates. Error bars indicate the average value of 3 independent biological replicates ± standard deviation.
