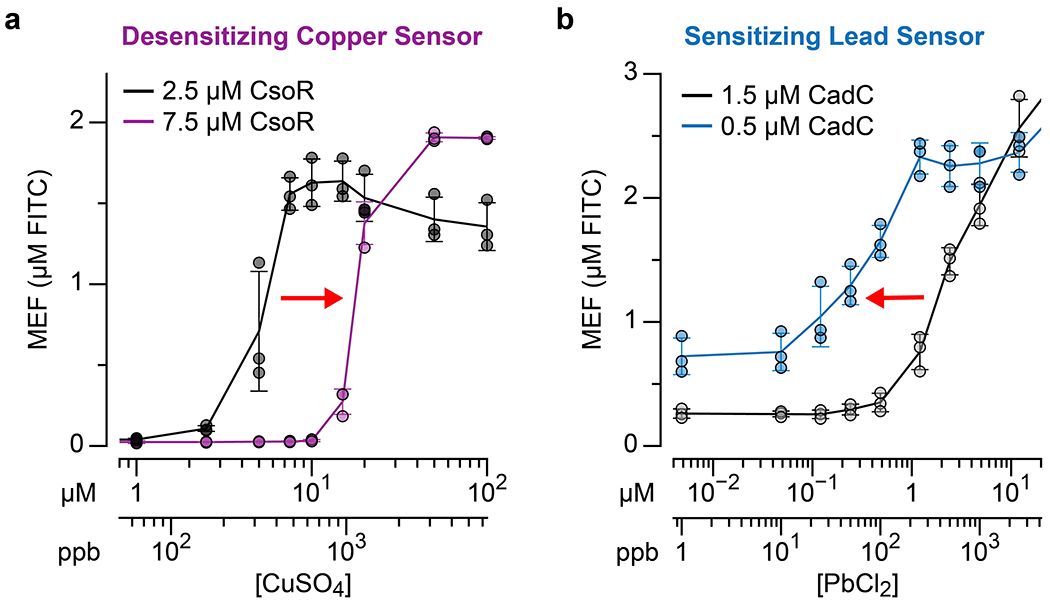
Extended Data Fig. 7 |.

a, increasing the concentration of CsoR desensitizes the copper sensor (dose response shift to higher concentrations), while b, decreasing the concentrations of CadC sensitizes the lead sensor (dose response shift to lower concentrations). The red arrows in the plots indicate the direction of dose response shift. All data shown for n=3 independent biological replicates as points with raw fluorescence values standardized to MEF (µM FITC). Error bars indicate the average value of 3 independent biological replicates ± standard deviation. 3WJdB DNA template concentrations used are: 25 nM for a and 1.5 µM CadC condition in b, and 10 nM for 0.5 µM CadC condition in b.
