
Fig. 4 |. Cross-reactivity of ROSALIND reactions can be corrected using an RNA logic circuit.
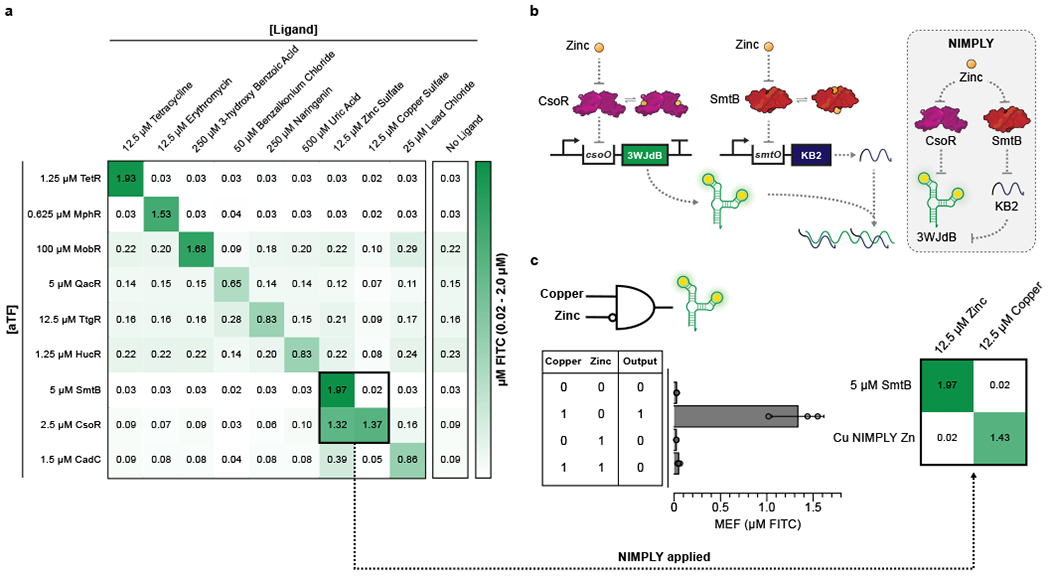
a, A subset of ROSALIND reactions were tested to evaluate cross-reactivity with different ligands. Significant crosstalk was observed from the copper sensing aTF, CsoR, where the sensor detects copper as well as zinc. The values on the heat map represent the average MEF (µM FITC) of n=3 independent biological replicates after 240 minutes (see Extended Data Fig. 5 for all data). 25 nM of DNA templates were used for reactions with TetR, MphR, SmtB and CsoR, 20 nM for QacR, 12.5 nM for HucR, 10 nM for CadC and 5 nM for MobR and TtgR. b, To fix the cross-reactivity of CsoR, a Cu NIMPLY Zn (Cu AND NOT Zn) logic gate was implemented consisting of the CsoR-controlled 3WJdB template and a SmtB-controlled template encoding a 3WJdB-interfering kleptamer (KB2). In the presence of zinc, the fluorescence of 3WJdB is inhibited by the presence of KB2, while in the presence of copper alone, only 3WJdB is produced. c, When implemented in ROSALIND, the Cu NIMPLY Zn circuit fixes the cross-reactivity of the copper sensor. Each reaction contained 25 nM of the 3WJdB template, 150 nM of the KB2 template, 2.5 µM of CsoR tetramer and 5 µM of SmtB dimer. The concentrations of copper and zinc tested in the bar plot are 10 µM each. The bar plot in c shows data for n=3 independent biological replicates as points with raw fluorescence values standardized to MEF (µM FITC), and bars representing averages of the replicates. Error bars indicate the average value of 3 independent biological replicates ± standard deviation. The matrix in c shows the average MEF (µM FITC) of n=3 independent biological replicates after 240 minutes. The aTF concentrations indicated in a and c are dimer concentrations except for CsoR, which is a tetramer.