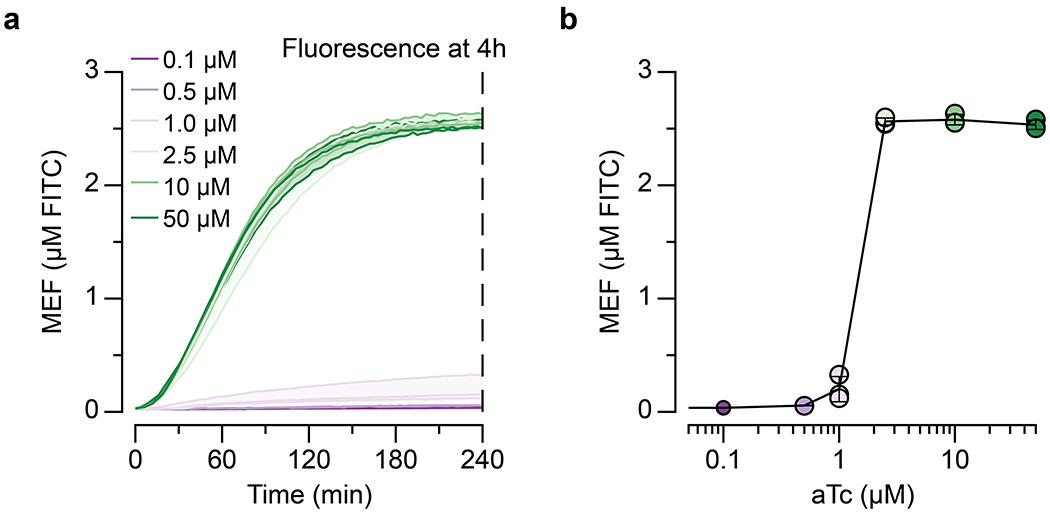
Extended Data Fig. 3 |.

A dose response curve of a TetR-regulated ROSALIND reaction is plotted from the measured and calibrated kinetics traces, using the four-hour end point fluorescence values at different ligand concentrations. a, kinetic traces of TetR–aTc induction at different aTc concentrations, and b, the corresponding four-hour fluorescence values plotted against the µM of aTc added. Reactions are generated using 25 nM of DNA and 1.25 µM of TetR dimer. All data shown for n=3 independent biological replicates as lines (a) or points (b) with raw fluorescence values standardized to MEF (µM FITC). Shading (a) and error bars (b) indicate the average value of 3 independent biological replicates ± standard deviation.
