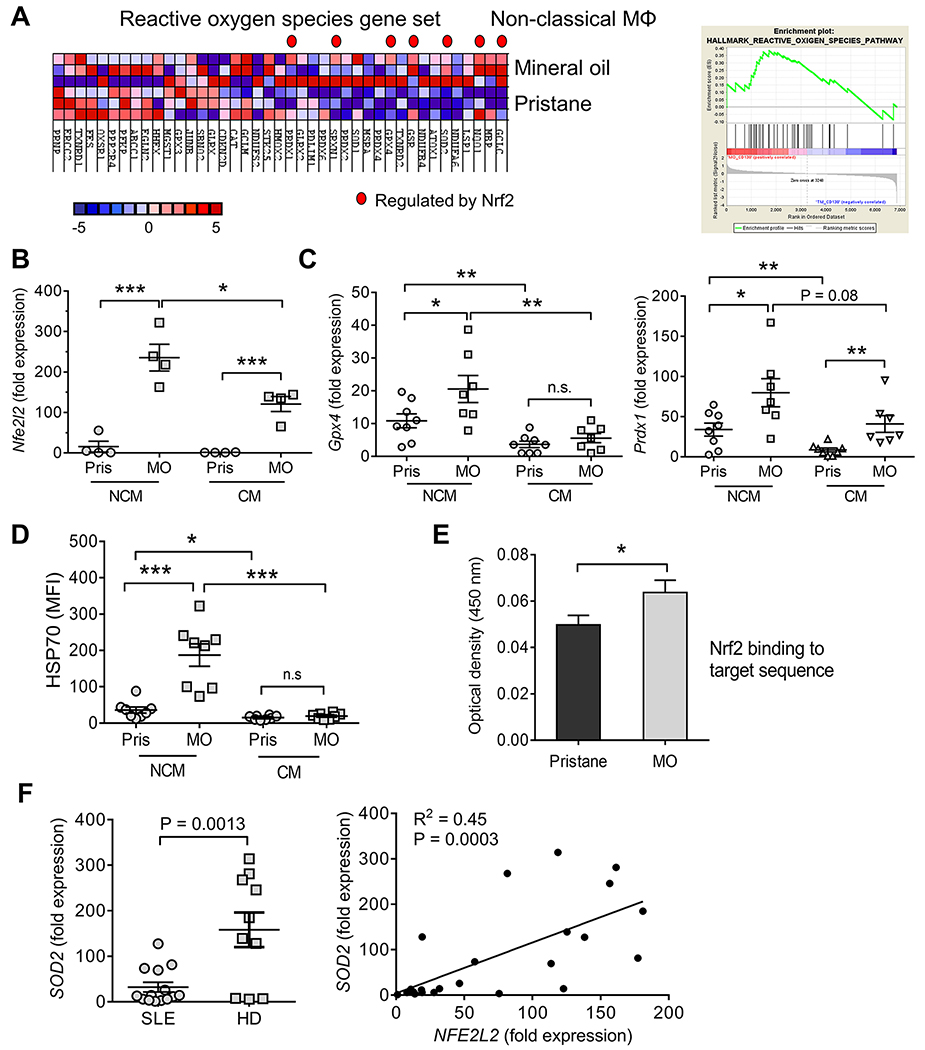
Figure 1. Transcriptional profiling of Mϕ.
A, NCM and CM from pristane and mineral oil (MO)-treated mice (d-14, 3 mice/group) were flow-sorted and analyzed by RNA-Seq. GSEA of RNA from NCM, MO vs. pristane treated mice, is shown on left. Nrf2-regulated genes are indicated by a red dot. Right, GSEA enrichment plot, hallmark reactive oxygen species pathway. B, Expression of Nfe2l2 relative to 18S rRNA by qPCR in flow-sorted NCM and CM from pristane (Pris) and MO-treated mice (4/group). C, Expression of Nrf2-regulated genes Gpx4 (left) and Prdx1 (right) relative to 18S rRNA in flow-sorted NCM and CM from pristane- and MO- treated mice. D, Intracellular staining (flow cytometry) for the Nrf2-regulated protein HSP70 (heat shock protein 70) in NCM and CM 14-days after pristane or MO treatment (MFI, mean fluorescence intensity). E, Nrf2 binding ARE-motif binding activity in 7-day pristane- vs. MO-treated B6 mice (Cayman Nrf2 transcription factor assay). F, Expression of SOD2 and NFE2L2 in the whole blood of SLE patients and healthy donors (HD, by qPCR). Left SOD2 expression relative to 18S rRNA. Right, bivariate analysis of SOD2 vs. NFE2L2 expression. *P < 0.05; **P < 0.01; ***P < 0.001 vs. control (Student t-test).

