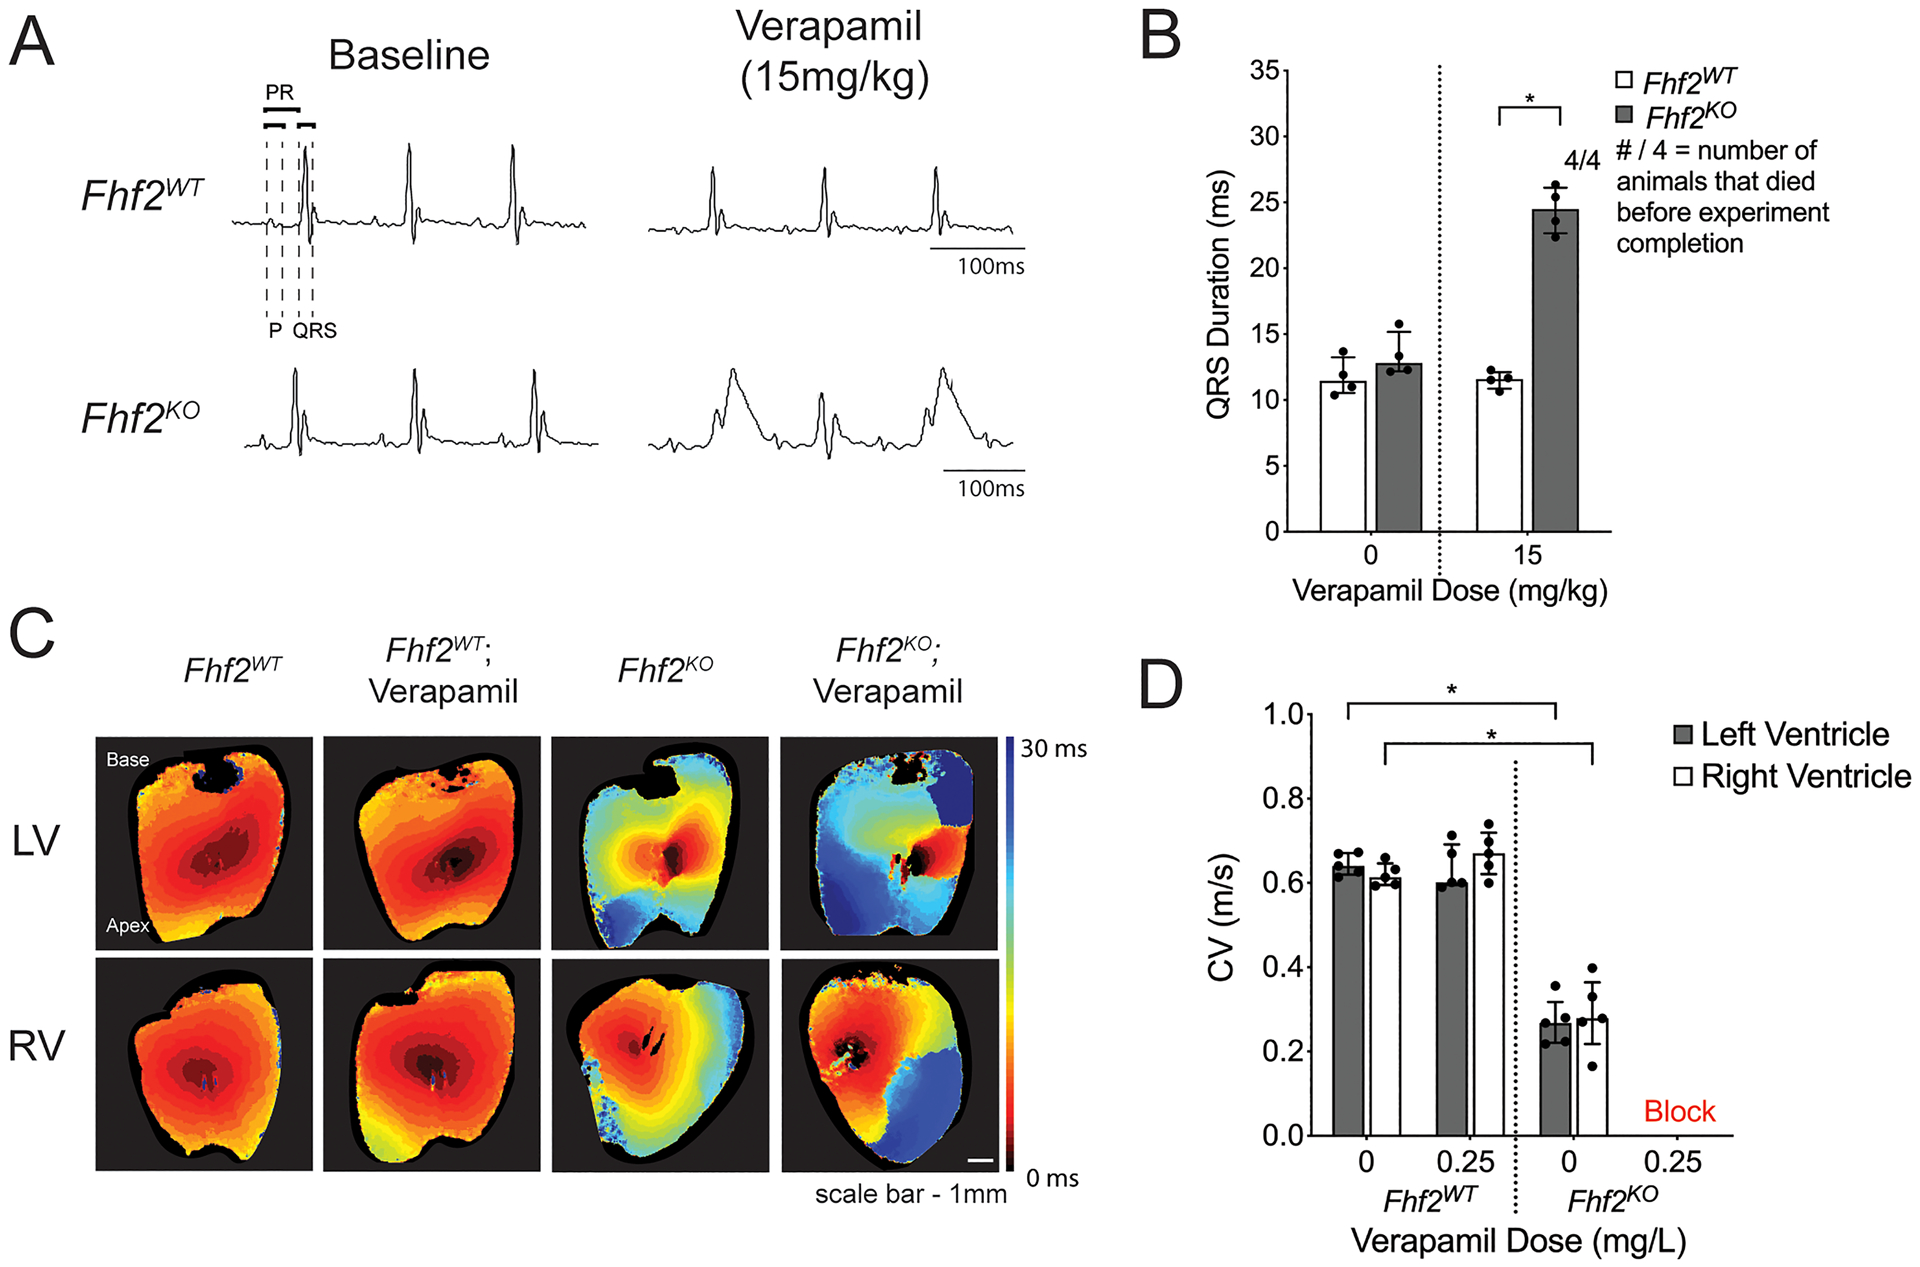
Figure 1. Pharmacological L-type calcium channel blockade produces conduction defects in Fhf2KO hearts.

(A,B) In vivo experiments with calcium channel blocker verapamil. (A) Representative surface ECG tracings of Fhf2WT (n=4) and Fhf2KO (n=4) mice subjected to verapamil (0mg/kg or 15mg/kg) via intraperitoneal (IP) injection and observed over 30 minutes. (B) QRS duration plotted against verapamil dose at 0mg/kg or 15mg/kg. QRS measured at 30 minutes or at last measurable time point prior to the onset of complete atrioventricular block. Fhf2WT treated with verapamil displayed no changes in QRS duration, and all mice survived verapamil treatment. Fhf2KO treated with verapamil experienced QRS prolongation and complete atrioventricular block. None of the Fhf2KO mice survived verapamil treatment. (C) Representative epicardial left and right ventricular activation maps. Multiple regions of conduction block were observed in Fhf2KO hearts (n=5) after treatment with verapamil. Fhf2WT hearts (n=5) did not show any change in CV after treatment. Hearts were paced at 100 milliseconds basic cycle length. Isochronal maps were generated based on the time to action potential peak. Isochrones are drawn 5 milliseconds apart. Time-scale index shown in sidebar. (D) Quantification of left and right ventricular epicardial conduction velocity before and after treatment with verapamil. Multiple regions of block precluded quantitative epicardial CV measurements in Fhf2KO hearts treated with verapamil. Data represent median ± interquartile range. *significant p values < 0.05, Wilcoxon signed-rank test was performed for comparisons between paired samples; Mann–Whitney U-test used for comparison of independent variables. See Online Table VIII for individual p-values.
