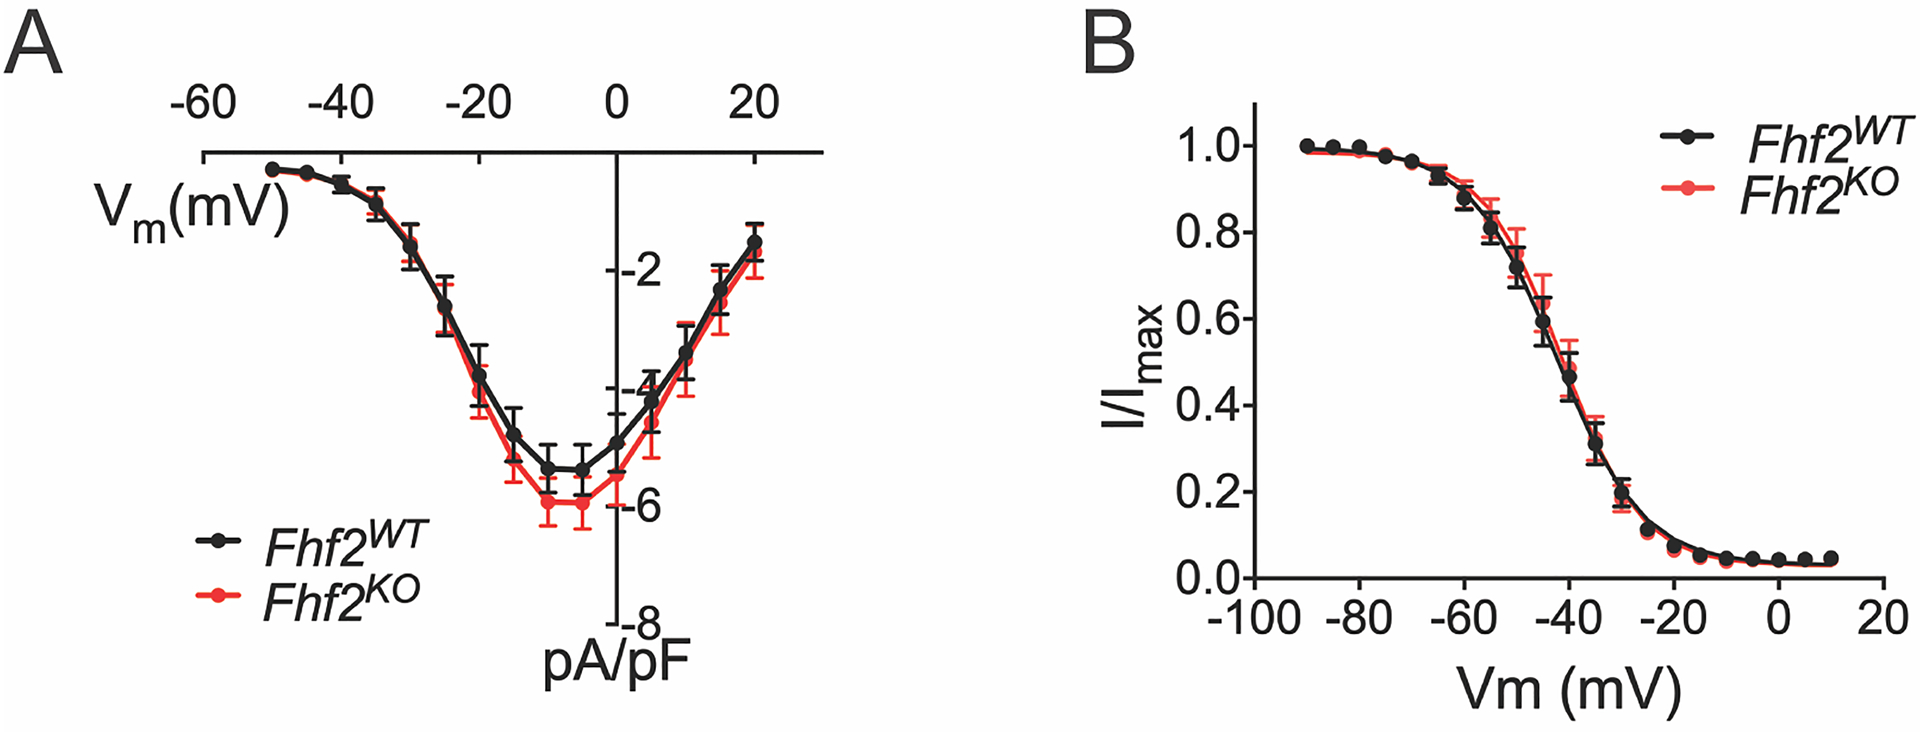
Figure 2. Measured calcium currents are similar in Fhf2WT and Fhf2KO cardiomyocytes.

(A) Calcium current density as a function of voltage. 200 ms voltage pulses were applied from holding Vm −90 mV to between −50 mV and +30mV in 5mV steps. Fhf2WT and Fhf2KO cardiomyocytes do not differ in peak calcium current density or voltage dependence of channel activation. (B) Cardiomyocyte voltage-gated calcium channel steady-state inactivation. Available ICa at 25°C after 500 ms conditioning at voltages spanning −130 to −20 mV is expressed as fraction of maximal ICa. Voltage dependence of inactivation does not significantly differ between Fhf2WT and Fhf2KO cardiomyocytes. (n=3 mice in each cohort, 10 cells/mouse). Data presented as mean ± standard error of the mean. Two-sample Kolmogorov-Smirnov test was used to compare current behavior between genotypes. Online Table VIII for individual p-values.
