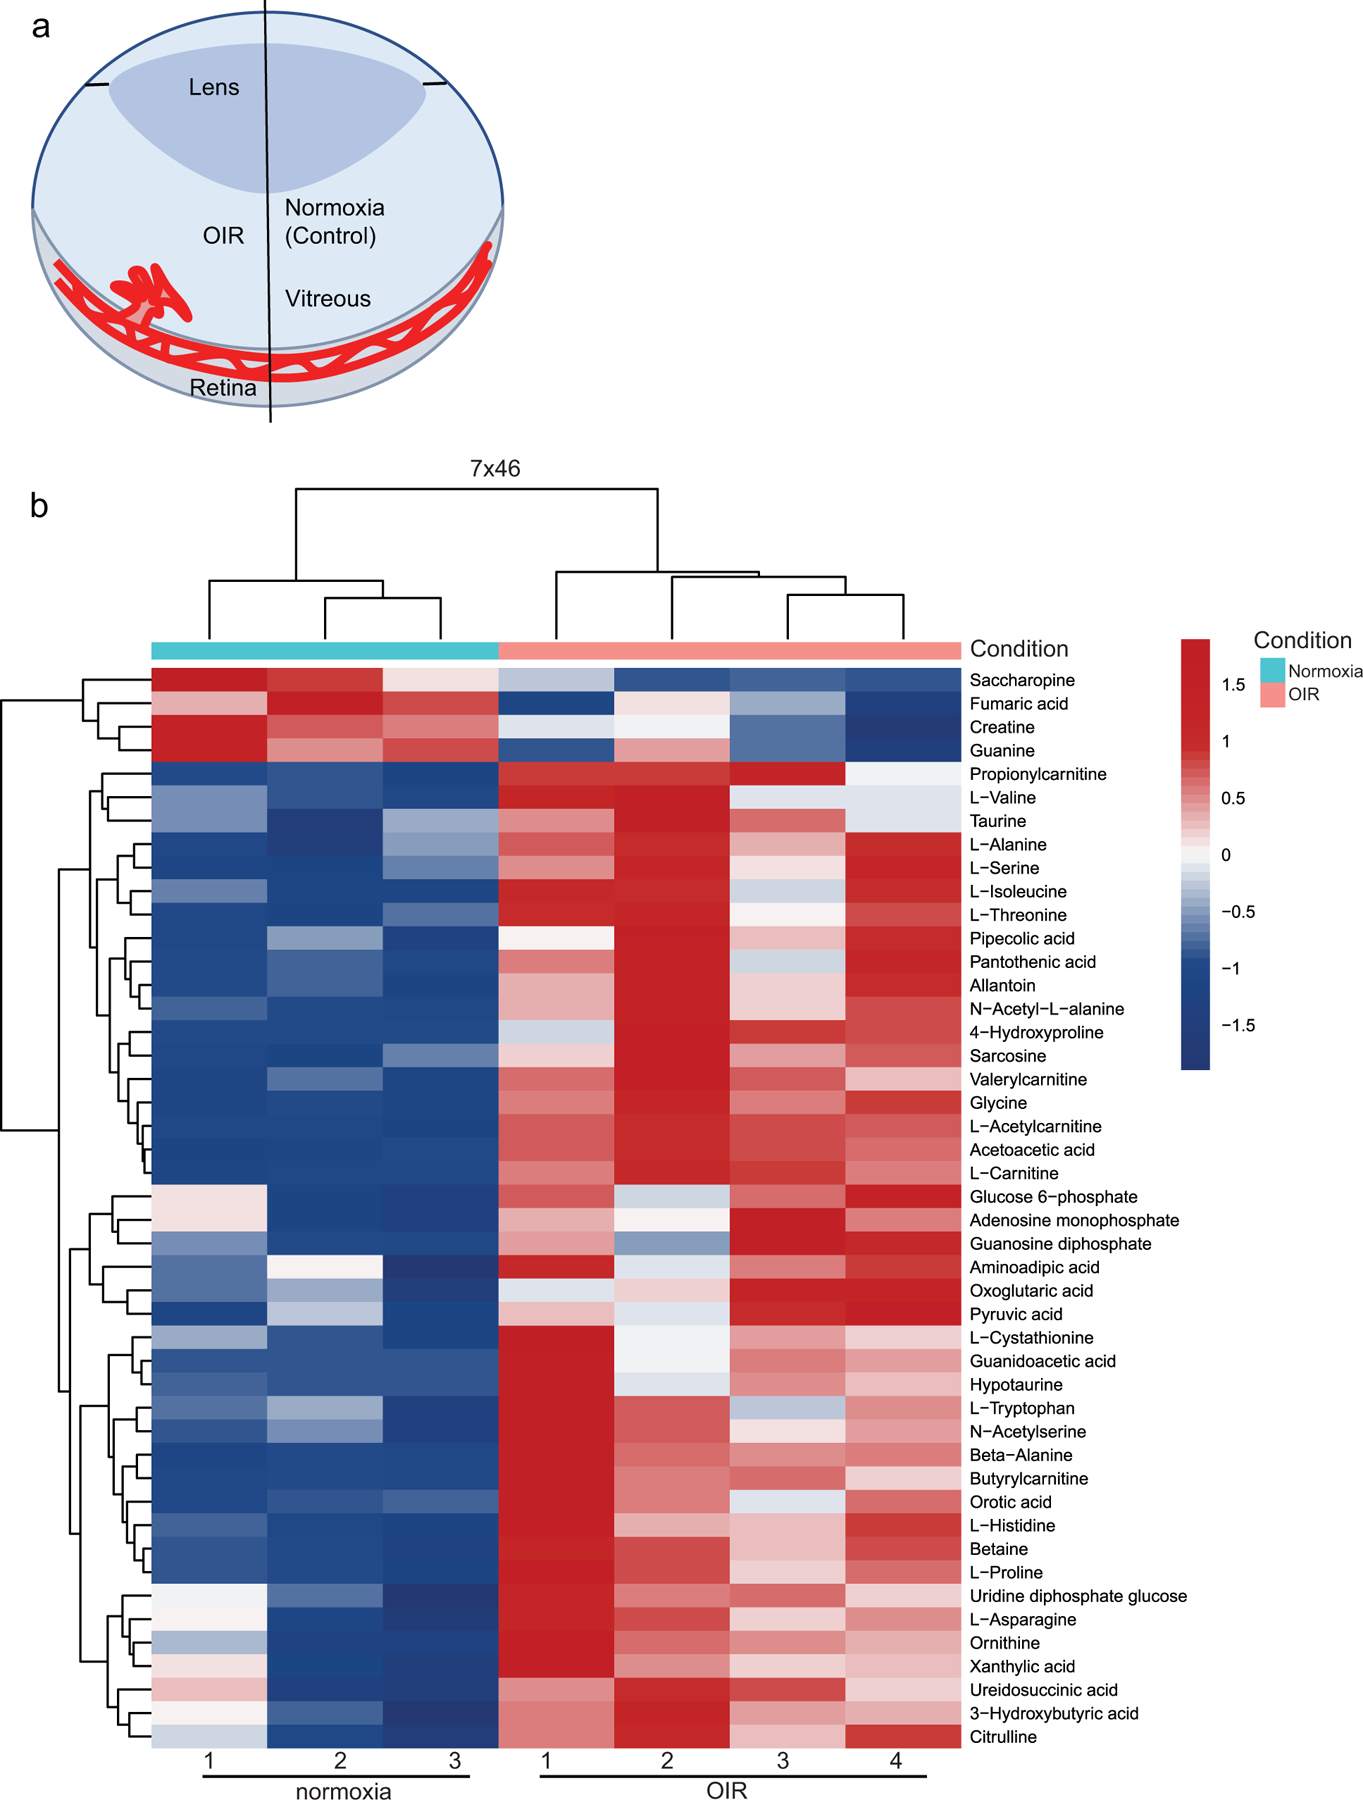
Fig. 5.

Unsupervised clustering analysis of samples. (a) Simplified schematic of the eye showing the retinal vasculature in OIR and control normoxic retinas (normoxia). (b) Control normoxic and OIR retinas were well resolved in an unsupervised clustering analysis. Using the significant metabolites (p<0.05) from the comparison, samples were clustered with the complete method and Euclidean distance function
