Fig. 6.

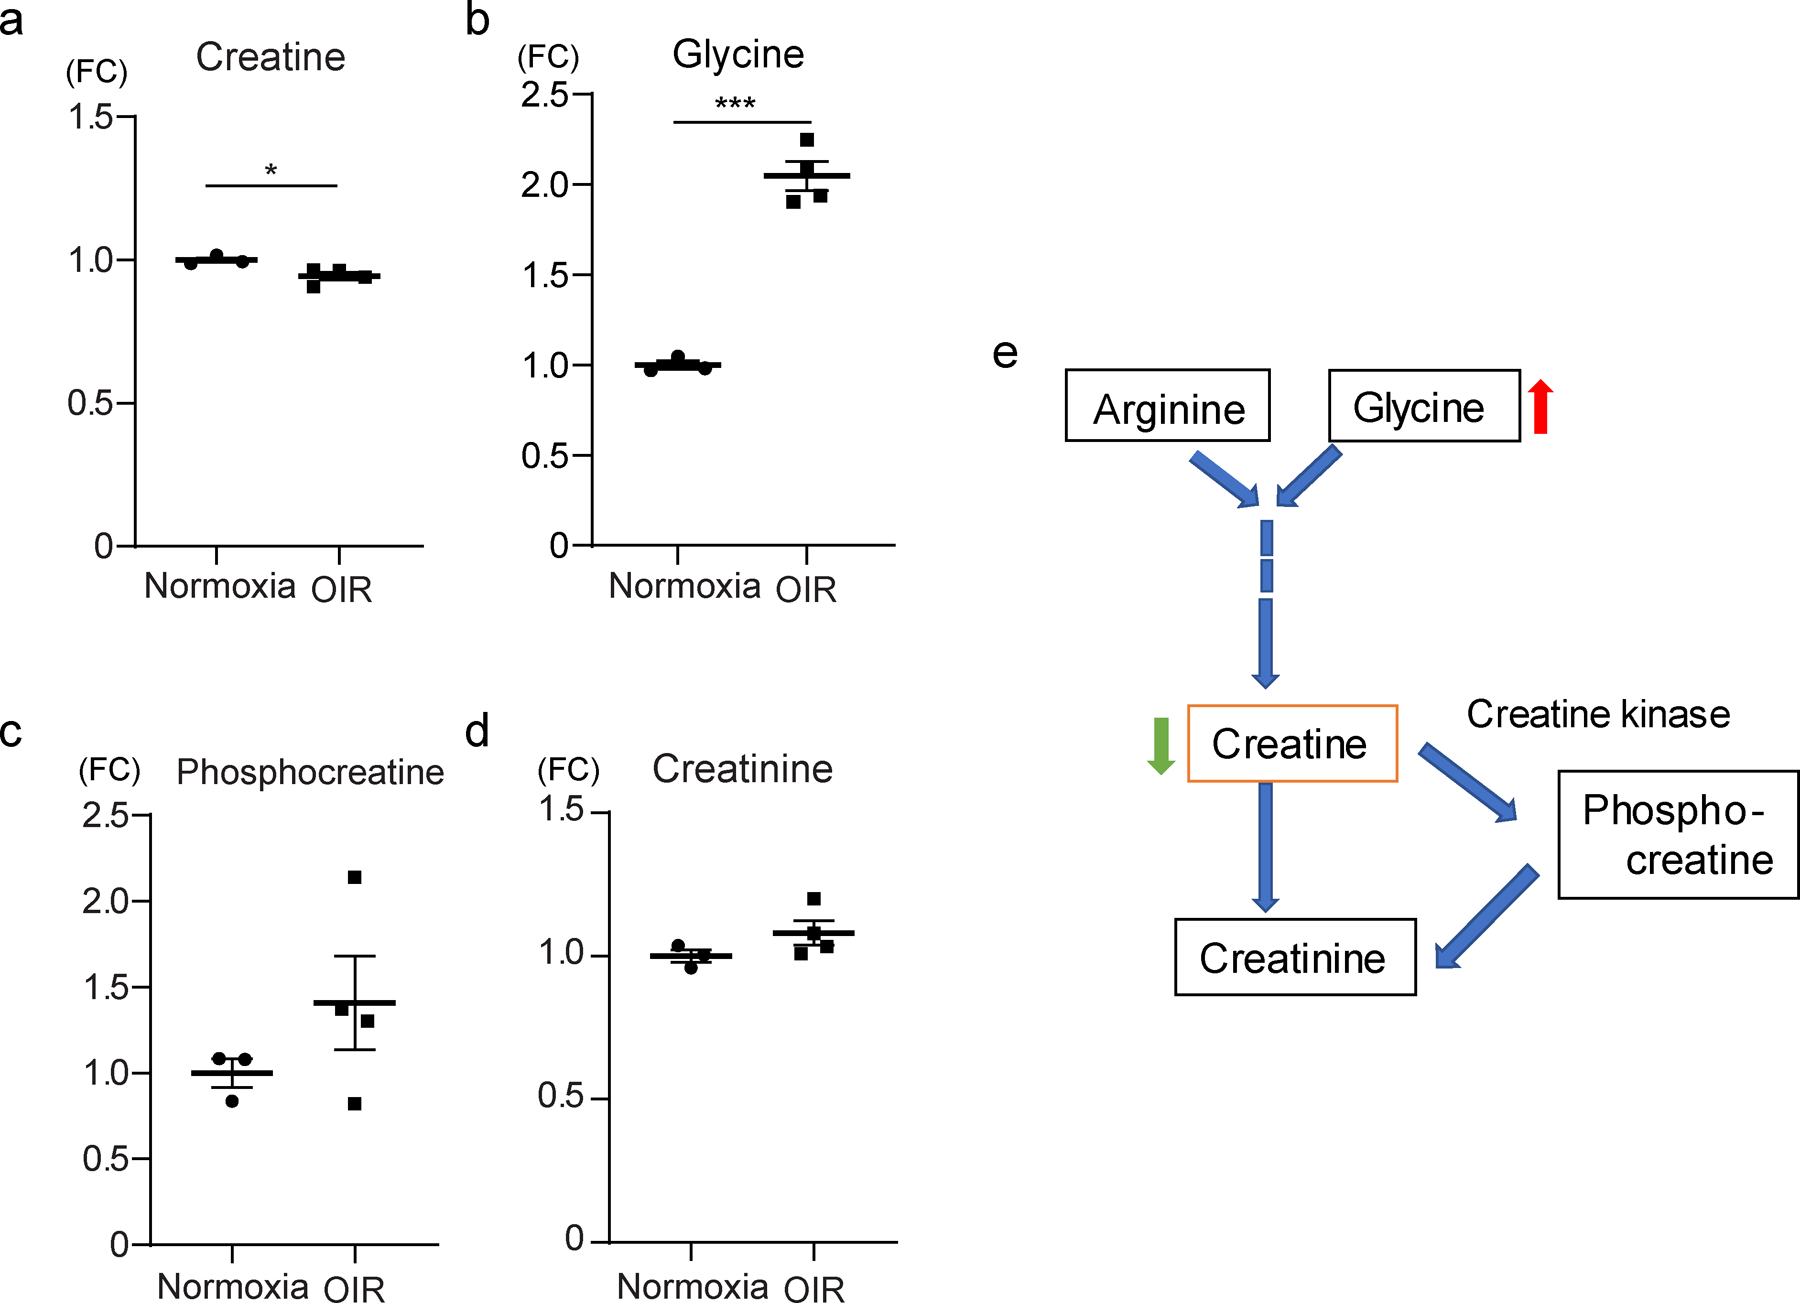
The levels of the glycine/creatine pathway in OIR mouse retina. (a) In OIR mice, creatine levels were decreased in the retina compared with control normoxic retinas (n=4, 3, respectively). (b) Glycine levels were increased in the retinas of OIR mice compared with control normoxic retinas (n=4, 3). (c, d) Phosphocreatine and creatinine were not significantly different between the two groups (n=4, 3). (e) Schematic of the glycine/creatine pathway. The data were analysed by Student’s t test and were expressed as mean±SEM. *p<0.05; ***p<0.001. FC, fold change vs control
