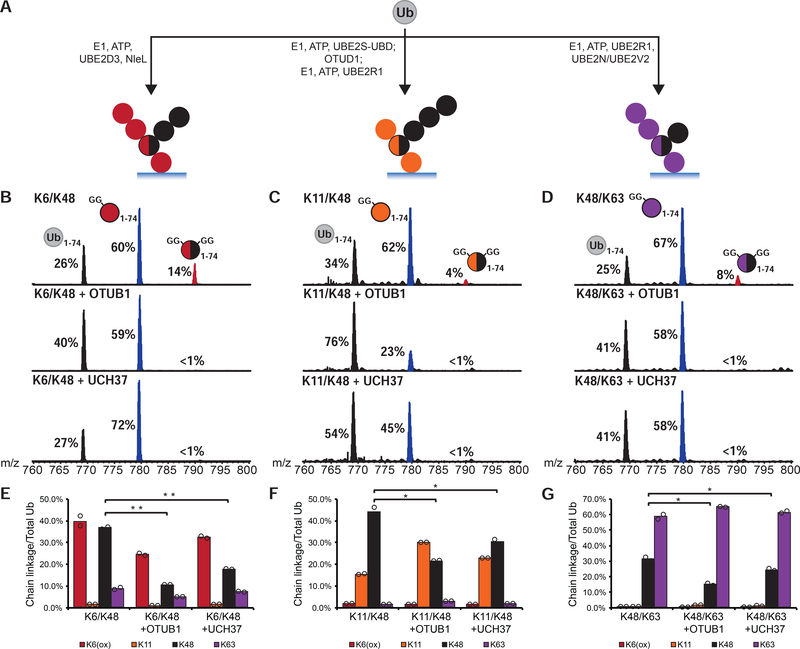
FIGURE 2. UCH37 Removes K48 Branch Points in Complex Chain Mixtures.
(A) Assembly of high molecular weight Ub chain mixtures used in this study.
(B-D) Ub middle-down (Ub MiD) MS analysis of HMW K6/K48, K11/K48, and K48/K63 chains (top) treated with either OTUB1 (3 μM, middle) or UCH37 (3 μM, bottom) for 1 h. Percentages correspond to the relative quantification values of the 11+ charge state for each Ub species: Ub1–74, 1xdiGly-Ub1–74, and 2xdiGly-Ub1–74.
(E-G) Ub-AQUA analysis of HMW K6/K48, K11/K48, and K48/K63 chains before and after a 1 h treatment with OTUB1 (15 μM, middle) or UCH37 (3 μM, last). For all points, *P<0.025, **P<0.01 (Student’s T-test)
All MS spectra are representative traces and quantification values (E-G) are derived from averaging fits of 2 independent experiments shown with SEM. See also Figure S2 and Table S1A–C.

