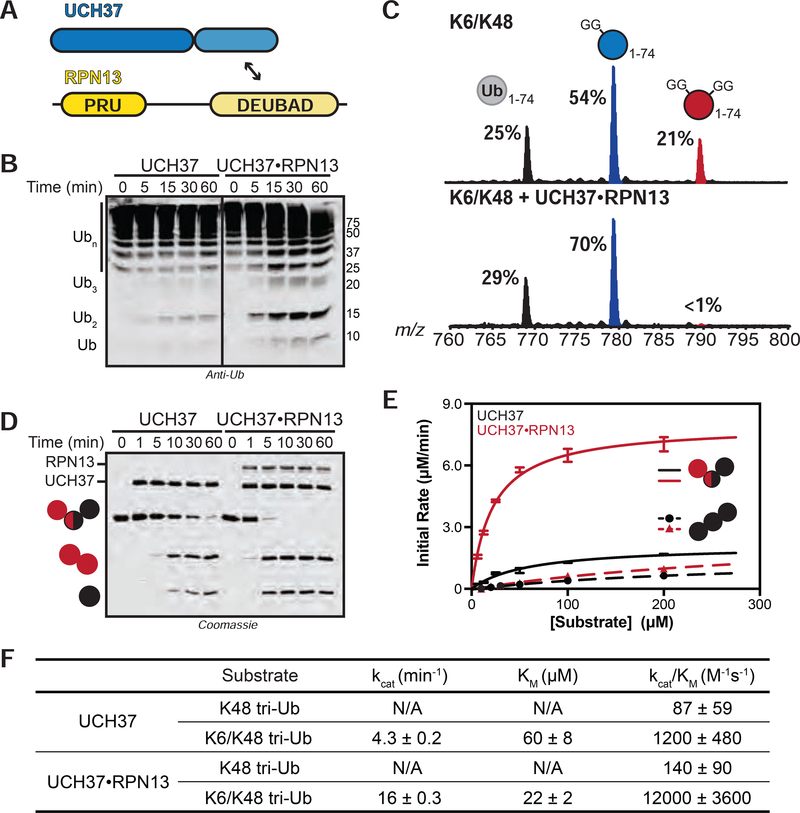
FIGURE 3. Steady-State Kinetic Analysis of Chain Debranching.
(A) Constructs used in this study.
(B) Western blot analysis of cleavage reactions with HMW K6/K48 chains. Concentrations used: UCH37 (1 μM) or UCH37•RPN13 (1 μM). Immunoblotting with the α-Ub P4D1 antibody.
(C) Ub MiD MS analysis of HMW K6/K48 chains (top) followed by treatment with UCH37•RPN13 (1 μM, bottom) for 1 h. Percentages correspond to the relative quantification values of the 11+ charge state for each Ub species: Ub1–74, 1xdiGly-Ub1–74, and 2xdiGly-Ub1–74.
(D) SDS-PAGE analysis of debranching reactions with UCH37 (1 μM) or UCH37•RPN13 (1 μM).
(E) Michaelis-Menten plot for the hydrolysis of native K6/K48 branched tri-Ub (solid line) or K48 tri-Ub (dashed line) by either free UCH37 (black) or UCH37•RPN13 (red). Enzyme concentrations are 0.5 μM for native K6/K48 branched tri-Ub and 1 μM for K48 tri-Ub.
(F) Table of kinetic parameters measured for all experiments following the initial rates of di-Ub formation.
All kinetic curves are representative traces and constants (E-F) derived from averaging fits of 3 independent experiments shown with SD. See also Figure S3.

