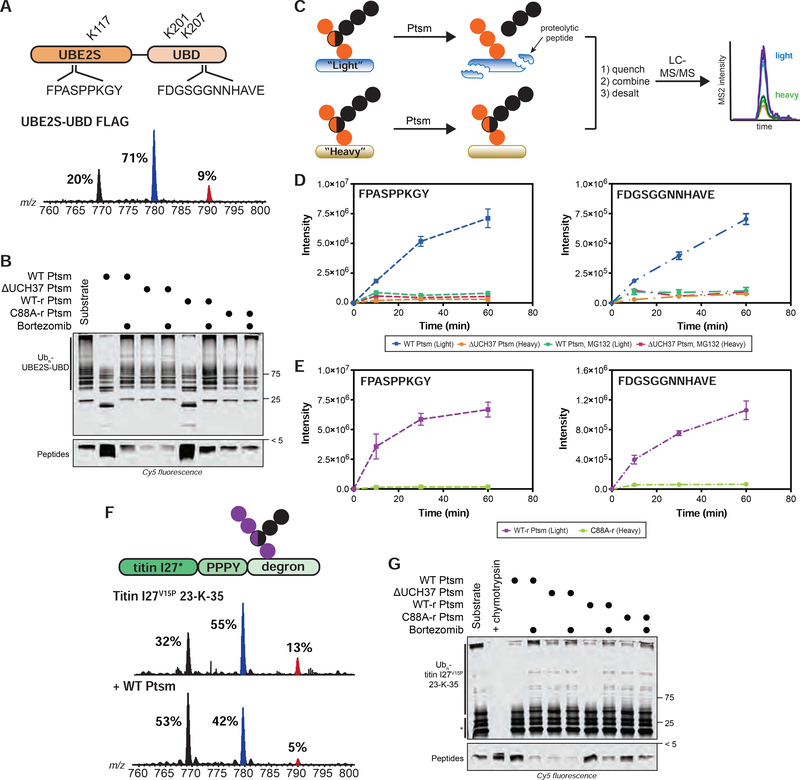
FIGURE 6. Ubiquitin Chain Debranching Promotes Proteasomal Degradation.
(A) UBE2S-UBD construct (top) showing ubiquitination sites (K117, K201, and K207) and the proteasome-derived UBE2S-UBD peptides detected by parallel reaction monitoring (PRM) MS. Ub MiD MS analysis of K11/K48-Ubn-UBE2S-UBD-FLAG (bottom).
(B) Degradation of K11/K48-Ubn-UBE2S-UBD after 1 h using the indicated Ptsm complexes (5 μg) under multi-turnover conditions in the presence and absence of bortezomib (1 μM).
(C) Schematic for tracking the formation of specific transition ions of UBE2S-UBD-derived proteolytic peptides. All reactions are completed as a two-plex experiment using ubiquitinated light and heavy (15N) UBE2S-UBD with different Ptsm complexes.
(D-E) PRM MS analysis of UBE2S-UBD peptides formed by Ptsms. The UBE2S peptide FPASPPKGY is shown on the left and the UBD peptide FDGSGGNNHAVE is on the right. (D) Light and heavy UBE2S-UBD were mixed with either WT Ptsm (5 μg) or ΔUCH37 Ptsm (5 μg), respectively, in the presence and absence of MG132 (10 μM). (E) Light and heavy UBE2S-UBD were mixed with either WT-r Ptsm (5 μg) or C88A-r Ptsm (5 μg).
(F) K48/K63-Ubn-titin-I27V15P-23-K-35 construct (top) used in this study. Ub MiD MS analysis of K48/K63-Ubn-titin-I27V15P-23-K-35 (middle) followed by treatment with WT Ptsm (10 μg, bottom).
(G) Degradation of K48/K63-Ubn-titin-I27V15P-23-K-35 after 1 h using the indicated Ptsm complexes (5 μg) under multi-turnover conditions in the presence and absence of bortezomib (1 μM). * indicates non-ubiquitinated titin-I27V15P-23-K-35 fragments Ub MiD MS percentages correspond to the relative quantification values of the 11+ charge state for each Ub species: Ub1–74, 1xdiGly-Ub1–74, and 2xdiGly-Ub1–74. Multiple-turnover assays were tracked by tricine-SDS-PAGE and visualized by cy5 fluorescence.
All MS curves are representative depictions from the sum of the transition ions of each monitored peptide (D-E) with a dashed line connecting the averaging of 4 independent experiments with SD. See also Figure S6 and Table S1F–G.

