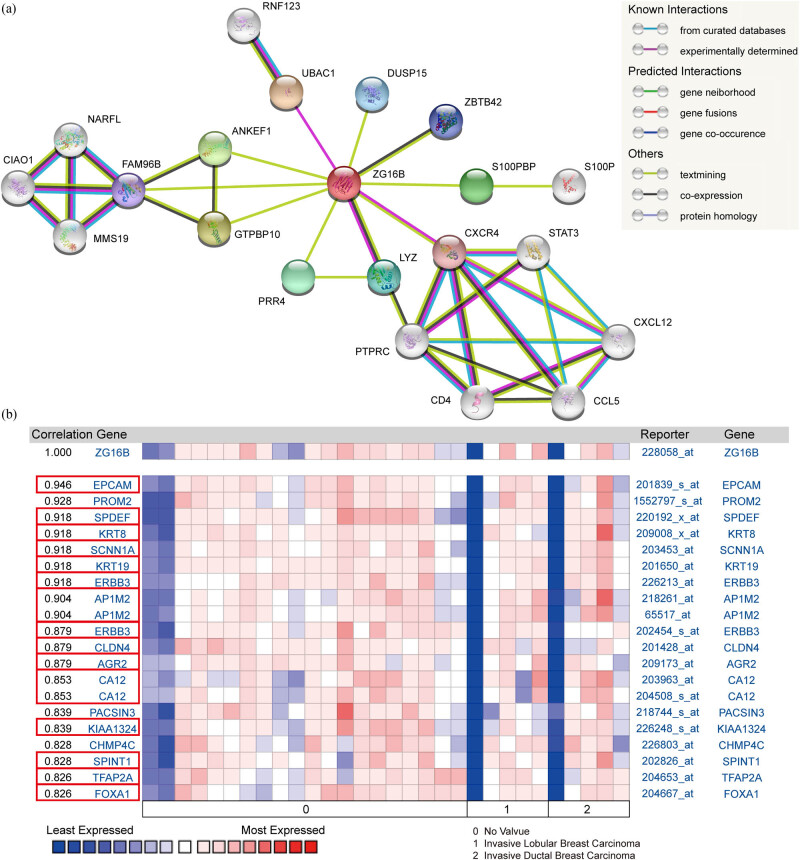
Figure 6.
Protein interactions and gene co-expression analysis of ZG16B. (a) The protein interaction network of ZG16B was drawn by STRING analysis. The colored nodes in the network represented ZG16B and its first stage of interactors, and the white nodes represented the second stage of interactors. The physical or functional relations between these proteins are interpreted in the conventional signs. (b) The gene co-expression analysis of ZG16B in Turashvili’s work was conducted by Oncomine. The co-expression genes of ZG16B in breast cancer and their coefficients were marked by red rectangles.

