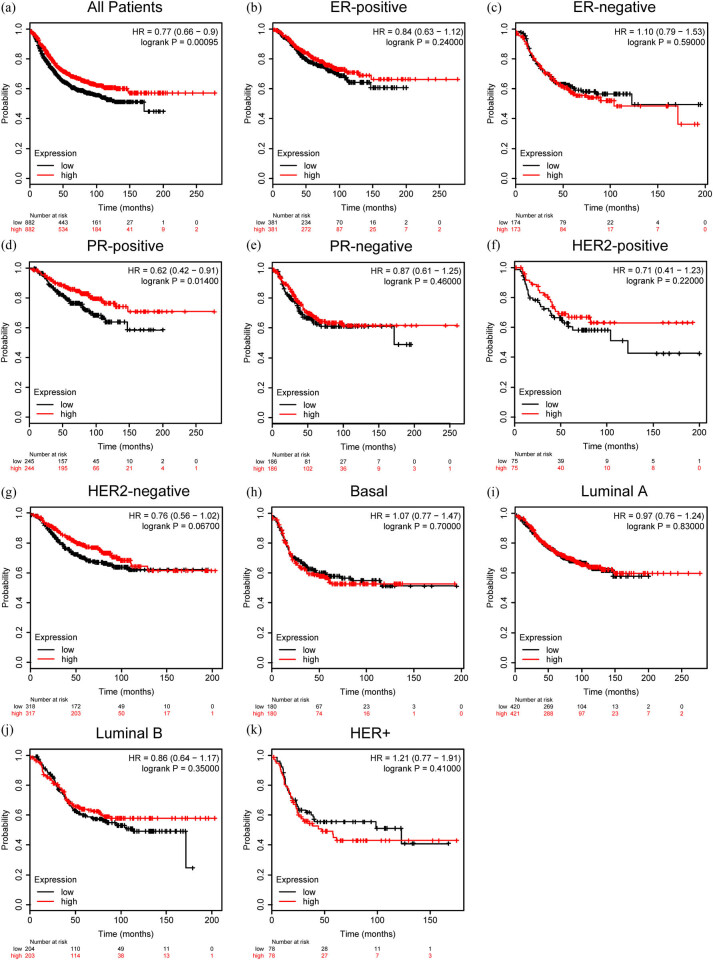
Figure 7.
Prognostic value of ZG16B expression in different subtypes of breast cancer. The RFS curves were drawn by Kaplan–Meier plotter in all breast cancer patients (a) and different subtypes of breast cancer, ER-positive (b), ER-negative (c), PR-positive (d), PR-negative (e), HER2-positive (f), HER2-negative (g), Basal (h), Luminal A (i), Luminal (j), and HER2+ (k).

