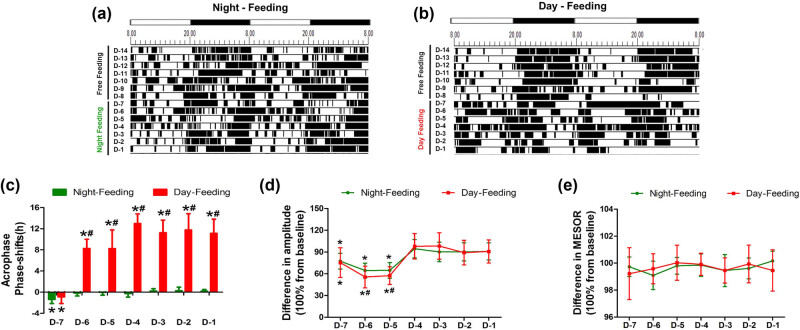
Figure 3.
The effect of feeding schedule on temperature rhythm during 7 days. (a and b) Representative double-plotted actograms show the temperature patterns after feeding schedule in a 12 h:12 h light:dark cycle. The black sections in the actograms represent higher temperature than the average value in 48 h, while the white ones represent lower temperature, the abscissa 8.00 means ZT0; 20.00 means ZT12. (c) Phase shift of acrophase. (d) Amplitude. (e) MESOR. *P < 0.05 vs mean values in 7-day pre-feeding period; # P < 0.05 vs Night-Feeding group, n = 8.

