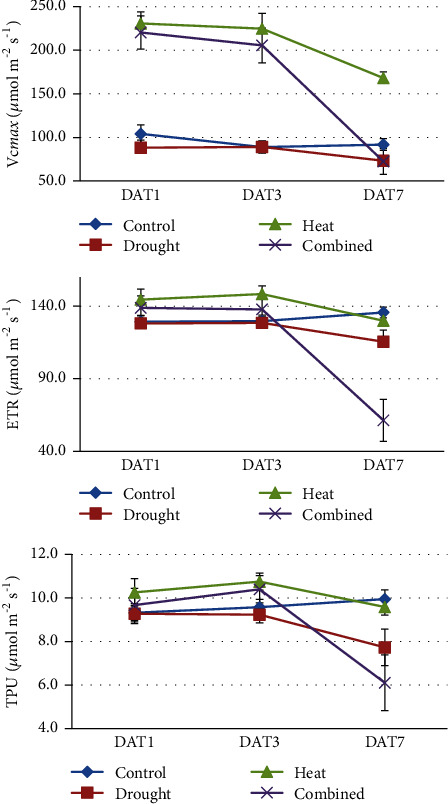
Figure 3.

Photosynthetic parameters, maximum carboxylation rate (Vcmax), photosynthetic electron transport rate (ETR), and the rate of triose phosphate use (TPU) as inferred from A/Ci curves (Sharkey et al., 2007) after 1, 3, and 7 days of treatment (DAT) of drought, heat, and combined heat and the well-watered control treatment at normal temperature. Data are means of the 12 genotypes ± one standard error.
