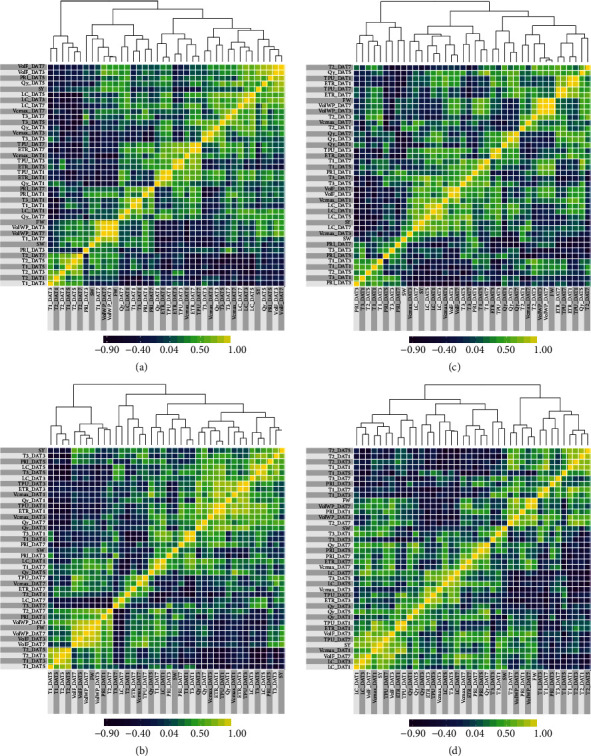
Figure 6.

Heatmaps of genotypic correlations for various phenomic and agronomic traits at various days after treatment (DAT) measured in control (a), drought (b), heat (c), and combined heat and drought (d) stress treatments. For trait abbreviations see Table 2.
