
Figure 12.
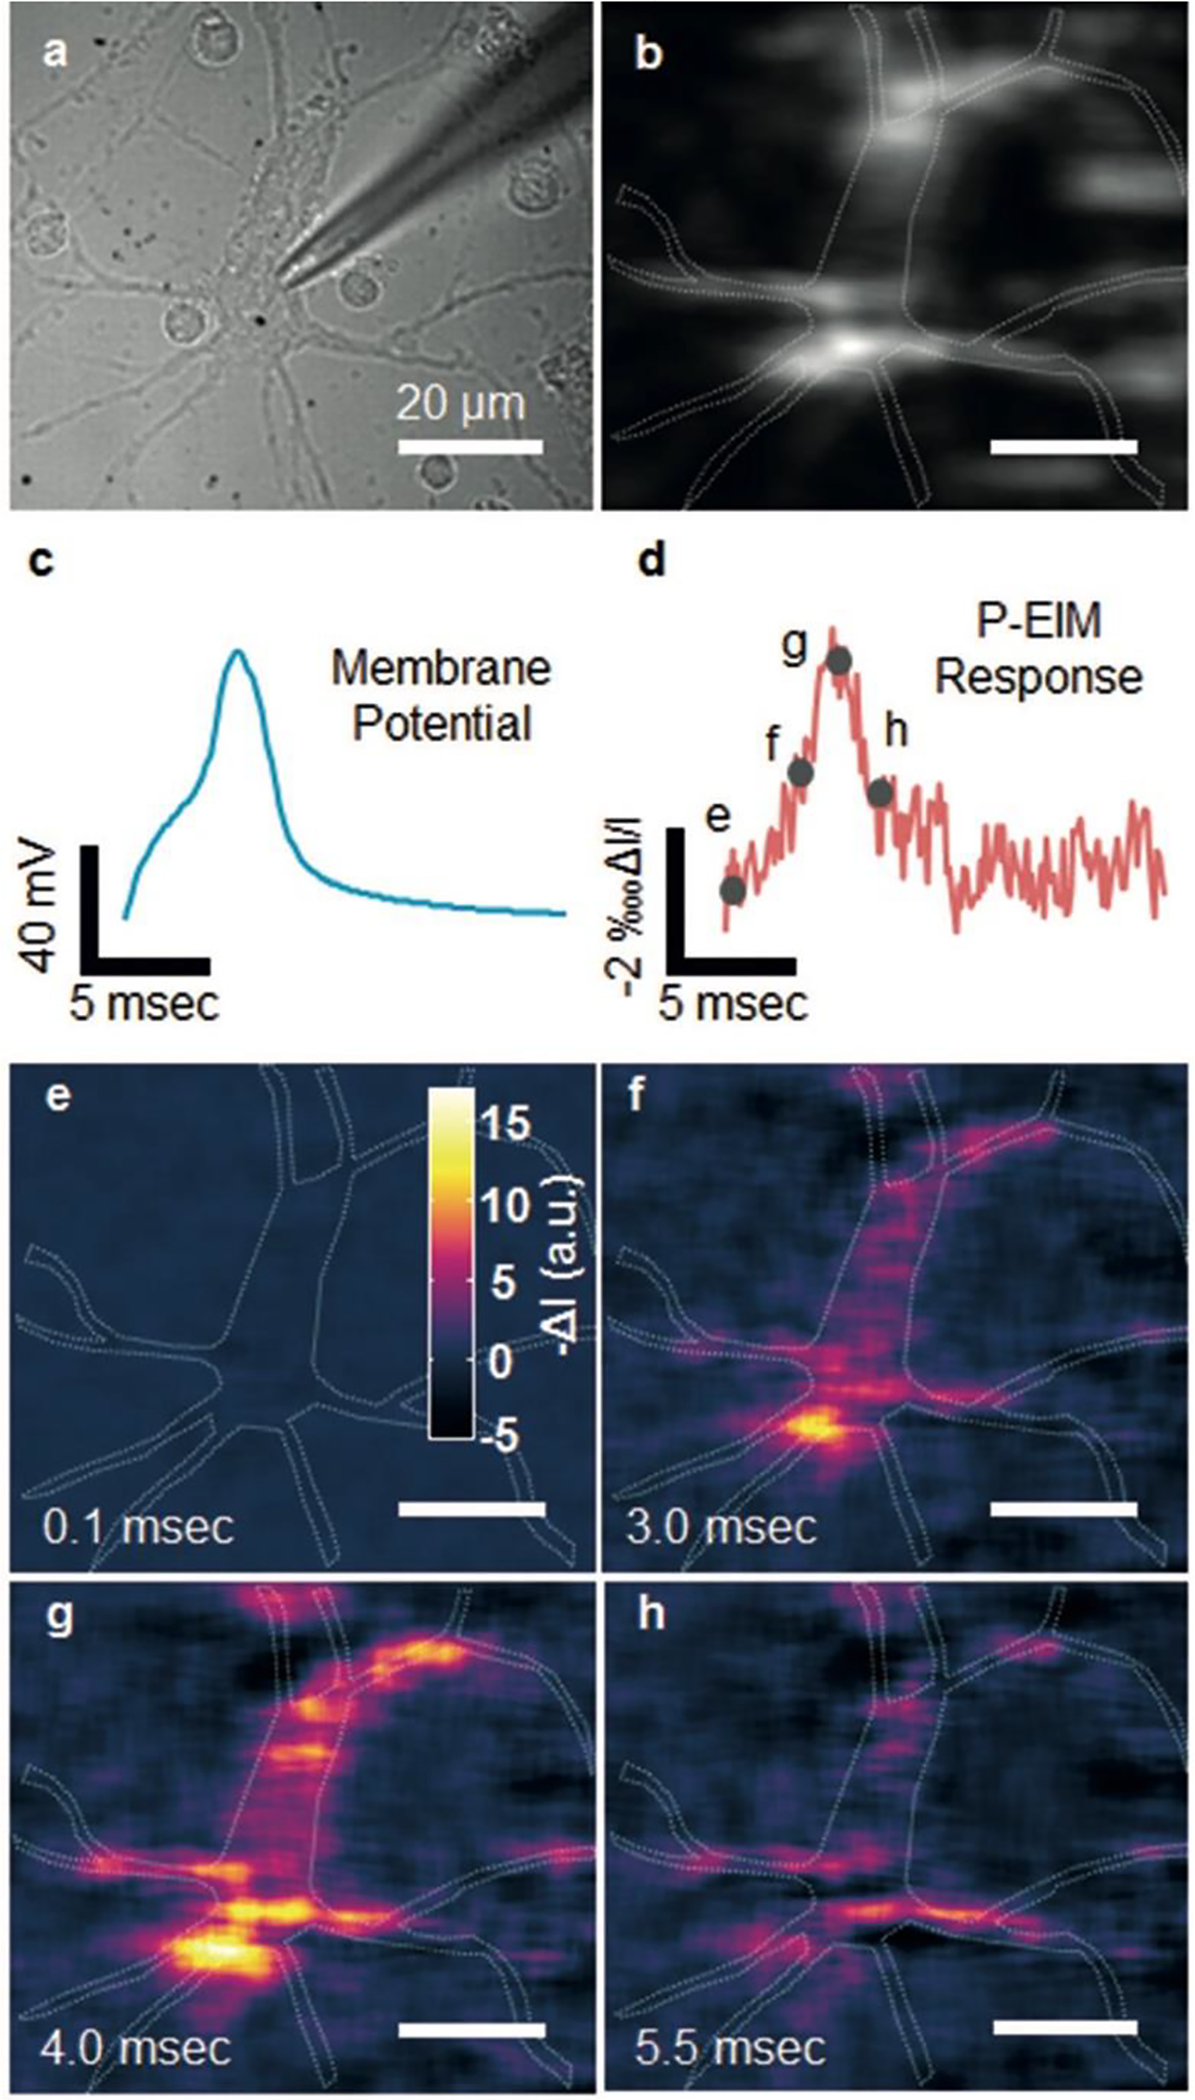
Plasmonic imaging of action potential in single neurons. a) Bright-field and b) plasmonic images of a hippocampal neuron, where the dashed lines mark the edge of a neuron. c) Patch clamp recording of action potential and d) simultaneous plasmonic-based electrochemical impedance microscopy (P-EIM) recording of action potential of the whole cell (frame rate of 10000 fps). To clearly illustrate the data, we normalized the intensity change DI with mean intensity I, and plotted the plasmonic intensity in negative intensity change for fair comparison. e–h) Snapshot P-EIM images of action potential at the moments marked by the gray spots in (d). The P-EIM images were averaged over 90 cycles of repeated action potential firing at 23 Hz repeat rate to reduce random noise. Reprinted with permission from ref285.