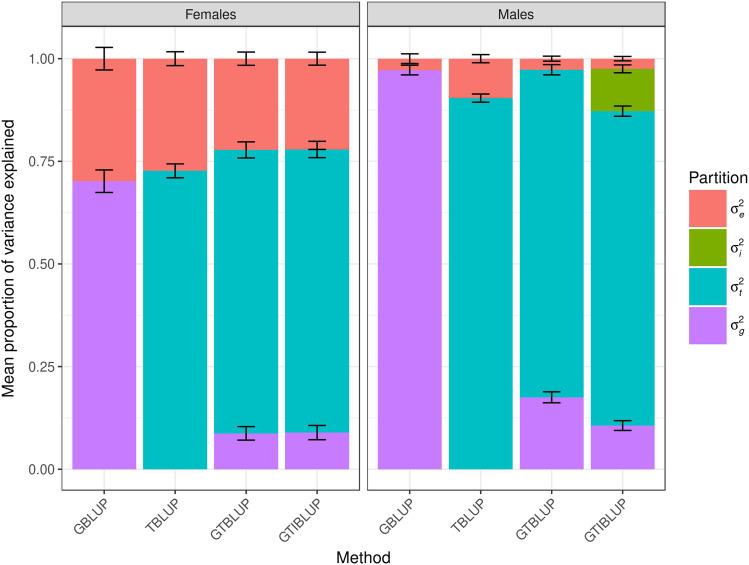
Figure 1.
Mean proportion of phenotypic variance for starvation resistance explained by each component in the models fitted to the training data set, i.e., GBLUP (σ2g and σ2e), TBLUP (σ2t and σ2e), GTBLUP (σ2g, σ2t and σ2e), and GTIBLUP (σ2g, σ2t, σ2i and σ2e). The bars represent the standard error of the mean. The left panel represents females, and the right panel represents males.

