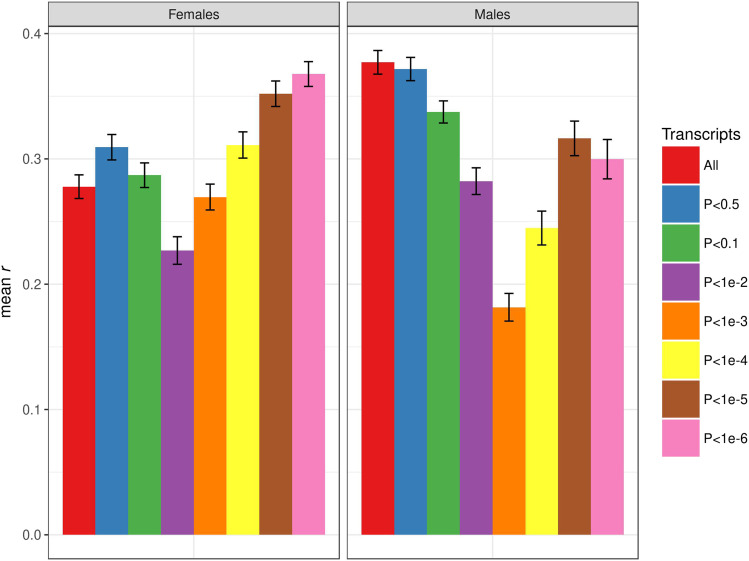
Figure 4.
Prediction accuracy for starvation resistance, measured as mean r (on the y-axis) in the test set, obtained by the TWAS-TBLUP model at different p-value thresholds for selecting genes. The bars represent the standard error of the mean. The left panel represents females, and the right panel represents males.

